Logs and Monitoring
HEAVY.AI writes to system logs and to HEAVY.AI-specific logs. System log entries include HEAVY.AI data-loading information, errors related to NVIDIA components, and other issues. For RHEL/CentOS, see /var/log/messages; for Ubuntu, see /var/log/syslog.
Most installation recipes use the systemd installer for HEAVY.AI, allowing consolidation of system-level logs. You can view the systemd log entries associated with HEAVY.AI using the following syntax in a terminal window:
By default, HEAVY.AI uses rotating logs with a symbolic link referencing the current HEAVY.AI server instance. Logs rotate when the instance restarts. Logs also rotate once they reach 10MB in size. HeavyDB keeps a maximum of 100 historical log files. These logs are located in the /log directory.
The HEAVY.AI web server can show current log files through a web browser. Only super users who are logged in can access the log files. To enable log viewing in a browser, use the enable-browser-logs command; see the configuration parameters for HEAVY.AI web server.
You can configure several of the logging behaviors described above using runtime flags. See Configuration Parameters.
Log Entry Types
Log levels are a hierarchy. Messages sent to the ERROR log always also go to the WARNING and INFO logs, and messages sent to WARNING always go to INFO.
heavydb.INFO
This is the best source of information for troubleshooting, and the first place you should check for issues. Provides verbose logging of:
Configuration settings in place when
heavydbstarts.Queries by user and session ID, with execution time (time for query to run) and total time (execution time plus time spent waiting to execute plus network wait time).
Examples
Configuration settings in place when
heavydbstarts:
When you use the wrong delimiter, you might see errors like this:
heavydb.WARNING
Reports nonfatal warning messages. For example:
heavydb.ERROR
Logs non-fatal error messages, as well as errors related to data ingestion.
Examples
When the path in the
heavysqlCOPYcommand references an incorrect file or path.When the table definition does not match the file referenced in the
COPYcommand.
heavydb.FATAL
heavydb.FATALReports `check failed` messages and a line number to identify where the error occurred. For example:
Live Logging
Browser-based Live Logging
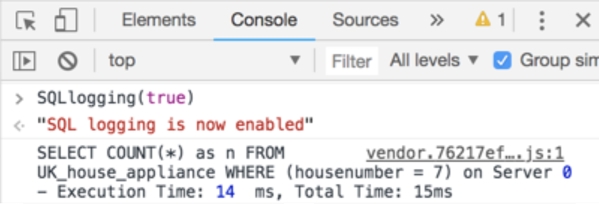
Using Chrome’s Developer Tools, you can interact with data in Immerse to see SQL and response times from OmniSciDB. The syntax is SQLlogging(true), entered under the console tab inline, as shown below.
Once SQL Logging is turned on, you can interact with the dashboard, see the SQL generated and monitor the response timing involved.
When you turn SQL logging on using SQLlogging(true), or turn it off using SQLlogging(false), the change takes effect only after the page has been reloaded or closed and reopened.
Command-Line Live Logging
You can “tail” the logs using a terminal window from the logs folder (usually /log) by the following syntax in a terminal window and specifying the heavydb log file you want to view:
Monitoring
Monitoring options include the following.
From the command line, you can run nvidia-smi to identify:
That the O/S can communicate with your NVIDIA GPU cards
NVIDIA SMI and driver version
GPU Card count, model, and memory usage
Aggregate memory usage by HEAVY.AI
You can also leverage systemd in non-Docker deployments to verify the status of heavydb:
and heavy_web_server:
These commands show whether the service is running (Active: active, (running)) or stopped (Active: failed (result: signal), or Active: inactive (dead)), the directory path, and a configuration summary.
Using heavysql, you can make these additional monitoring queries:
\status
Returns: server version, start time, and server edition.
In distributed environments, returns: Name of leaf, leaf version number, leaf start time.
\memory_summary
Returns a hybrid summary of CPU and GPU memory allocation. HEAVY.AI Server CPU Memory Summary shows the maximum amount of memory available, what is in use, allocated and free. HEAVY.AI allocates memory in 2 GB fragments on both CPU and GPU. HEAVY.AI Server GPU Memory Summary shows the same memory summary at the individual card level. Note: HEAVY.AI does not pre-allocate all of the available GPU memory.
A cold start of the system might look like this:
After warming up the data, the memory might look like this:
