HEAVY.AI Docs
v8.1.0
v8.1.0
  • Welcome to HEAVY.AI Documentation
  • Overview
    • Overview
    • Release Notes
  • Installation and Configuration
    • System Requirements
      • Hardware Reference
      • Software Requirements
      • Licensing
    • Installation
      • Free Version
      • Installing on Docker
        • HEAVY.AI Installation using Docker on Ubuntu
      • Installing on Ubuntu
        • HEAVY.AI Installation on Ubuntu
        • Install NVIDIA Drivers and Vulkan on Ubuntu
      • Installing on Rocky Linux / RHEL
        • HEAVY.AI Installation on RHEL
        • Install NVIDIA Drivers and Vulkan on Rocky Linux and RHEL
      • Getting Started on AWS
      • Getting Started on GCP
      • Getting Started on Azure
      • Getting Started on Kubernetes (BETA)
      • Upgrading
        • Upgrading HEAVY.AI
        • Upgrading from Omnisci to HEAVY.AI 6.0
        • CUDA Compatibility Drivers
      • Uninstalling
      • Ports
    • Services and Utilities
      • Using Services
      • Using Utilities
    • Executor Resource Manager
    • Configuration Parameters
      • Overview
      • Configuration Parameters for HeavyDB
      • Configuration Parameters for HEAVY.AI Web Server
      • Configuration Parameters for HeavyIQ
    • Security
      • Roles and Privileges
        • Column-Level Security
      • Connecting Using SAML
      • Implementing a Secure Binary Interface
      • Encrypted Credentials in Custom Applications
      • LDAP Integration
    • Distributed Configuration
  • Loading and Exporting Data
    • Supported Data Sources
      • Kafka
      • Using HeavyImmerse Data Manager
      • Importing Geospatial Data
    • Command Line
      • Loading Data with SQL
      • Exporting Data
  • SQL
    • Data Definition (DDL)
      • Datatypes
      • Users and Databases
      • Tables
      • System Tables
      • Views
      • Policies
      • Comment
    • Data Manipulation (DML)
      • SQL Capabilities
        • ALTER SESSION SET
        • ALTER SYSTEM CLEAR
        • DELETE
        • EXPLAIN
        • INSERT
        • KILL QUERY
        • LIKELY/UNLIKELY
        • SELECT
        • SHOW
        • UPDATE
        • Arrays
        • Logical Operators and Conditional and Subquery Expressions
        • Table Expression and Join Support
        • Type Casts
      • Geospatial Capabilities
        • Uber H3 Hexagonal Modeling
      • Functions and Operators
      • System Table Functions
        • generate_random_strings
        • generate_series
        • tf_compute_dwell_times
        • tf_feature_self_similarity
        • tf_feature_similarity
        • tf_geo_rasterize
        • tf_geo_rasterize_slope
        • tf_graph_shortest_path
        • tf_graph_shortest_paths_distances
        • tf_load_point_cloud
        • tf_mandelbrot*
        • tf_point_cloud_metadata
        • tf_raster_contour_lines; tf_raster_contour_polygons
        • tf_raster_graph_shortest_slope_weighted_path
        • tf_rf_prop_max_signal (Directional Antennas)
        • ts_rf_prop_max_signal (Isotropic Antennas)
        • tf_rf_prop
      • Window Functions
      • Reserved Words
      • SQL Extensions
      • HeavyIQ LLM_TRANSFORM
  • HeavyImmerse
    • Introduction to HeavyImmerse
    • Admin Portal
    • Control Panel
    • Working with Dashboards
      • Dashboard List
      • Creating a Dashboard
      • Configuring a Dashboard
      • Duplicating and Sharing Dashboards
    • Measures and Dimensions
    • Using Parameters
    • Using Filters
    • Using Cross-link
    • Chart Animation
    • Multilayer Charts
    • SQL Editor
    • Customization
    • Joins (Beta)
    • Chart Types
      • Overview
      • Bubble
      • Choropleth
      • Combo
      • Contour
      • Cross-Section
      • Gauge
      • Geo Heatmap
      • Heatmap
      • Linemap
      • Number
      • Pie
      • Pointmap
      • Scatter Plot
      • Skew-T
      • Table
      • Text Widget
      • Wind Barb
    • Deprecated Charts
      • Bar
      • Combo - Original
      • Histogram
      • Line
      • Stacked Bar
    • HeavyIQ SQL Notebook
  • HEAVYIQ Conversational Analytics
    • HeavyIQ Overview
      • HeavyIQ Guidance
  • HeavyRF
    • Introduction to HeavyRF
    • Getting Started
    • HeavyRF Table Functions
  • HeavyConnect
    • HeavyConnect Release Overview
    • Getting Started
    • Best Practices
    • Examples
    • Command Reference
    • Parquet Data Wrapper Reference
    • ODBC Data Wrapper Reference
    • Raster Data Wrapper Reference
  • HeavyML (BETA)
    • HeavyML Overview
    • Clustering Algorithms
    • Regression Algorithms
      • Linear Regression
      • Random Forest Regression
      • Decision Tree Regression
      • Gradient Boosting Tree Regression
    • Principal Components Analysis
  • Python / Data Science
    • Data Science Foundation
    • JupyterLab Installation and Configuration
    • Using HEAVY.AI with JupyterLab
    • Python User-Defined Functions (UDFs) with the Remote Backend Compiler (RBC)
      • Installation
      • Registering and Using a Function
      • User-Defined Table Functions
      • RBC UDF/UDTF Example Notebooks
      • General UDF/UDTF Tutorial Notebooks
      • RBC API Reference
    • Ibis
    • Interactive Data Exploration with Altair
    • Additional Examples
      • Forecasting with HEAVY.AI and Prophet
  • APIs and Interfaces
    • Overview
    • heavysql
    • Thrift
    • JDBC
    • ODBC
    • Vega
      • Vega Tutorials
        • Vega at a Glance
        • Getting Started with Vega
        • Getting More from Your Data
        • Creating More Advanced Charts
        • Using Polys Marks Type
        • Vega Accumulator
        • Using Transform Aggregation
        • Improving Rendering with SQL Extensions
      • Vega Reference Overview
        • data Property
        • projections Property
        • scales Property
        • marks Property
      • Migration
        • Migrating Vega Code to Dynamic Poly Rendering
      • Try Vega
    • RJDBC
    • SQuirreL SQL
    • heavyai-connector
  • Tutorials and Demos
    • Loading Data
    • Using Heavy Immerse
    • Hello World
    • Creating a Kafka Streaming Application
    • Getting Started with Open Source
    • Try Vega
  • Troubleshooting and Special Topics
    • FAQs
    • Troubleshooting
    • Vulkan Renderer
    • Optimizing
    • Known Issues and Limitations
    • Logs and Monitoring
    • Archived Release Notes
      • Release 6.x
      • Release 5.x
      • Release 4.x
      • Release 3.x
Powered by GitBook
On this page
  • General Process
  • Joins vs. Crosslinks
  • Creating a Join
  • Edit a Join
  • Update a Join
Export as PDF
  1. HeavyImmerse

Joins (Beta)

PreviousCustomizationNextChart Types

Last updated 1 year ago

In Heavy Immerse, you can join columns from different tables so that you can access data across join and geojoin relations. Heavy Immerse supports two join types (left and inner). Using joins in queries provides increased performance and flexibility over cohorts since measures and dimensions can be built from columns of joined tables.

To enable joins in Heavy Immerse, set the feature flag to TRUE.

In HEAVY.AI Release 7.0.0, Joins in Heavy Immerse is beta functionality.

In the 7.0.0 beta version of Joins, adherence to column types is essential when performing join operations. Integer columns designated as INT are incompatible with those classified as BIGINT, and cannot be merged together.

General Process

The following scenario describes at a high level a typical Heavy Immerse join process:

  1. You discover that data you want to chart is not available in the primary or left-hand table.

  2. However, the data that you want is available in a different table and the two tables share a common join column.

  3. Join columns must match in both type and in contents. Immerse currently provides join recommendations based on data types and not column data contents. However, Immerse does provide column previews for you to determine suitability by inspection.

  4. Once the join column is selected, you determine join type. This defaults to an "inner" join, which includes non-null matching records. By switching the join mode to "left" you can restrict the results to only look-ups of values which appear in the left hand table.

  5. You need to name the join before proceeding. This name will then become the default data source for the current chart, but is also available for use in other charts within your dashboard. Joins are persisted within dashboards and therefore can be shared with others.

Joins can be used as a data source wherever tables are used in Heavy Immerse.

Joins vs. Crosslinks

Joins and crosslinks have some similarities and differences, and their use depends on your data and how you want to chart it.

  • A crosslink uses common columns to coordinate cross filtering behavior between charts.

  • A join performs a SQL command which creates a new named datasource containing columns from both tables. Dimensions and measures can be based on the combination of columns.

For example, consider the following use cases:

  • Join: You have flight data that contains a plane model number and other flight information, such as model number, arrival city, destination city, arrival time, and departure time. You want to combine this with a plane reference dataset that contains information about the airplane itself (model number, number of engines, year built, and so on). You can create a join from these two datasets on the model_number column, and use fields from both datasets to create your charts. For example, you could color flights based on the airplane age.

  • Crosslink: With the same two starting tables, you establish a crosslink on plane model number. You make a map chart of flights from the flights table and a histogram combination chart of airplane ages from the airplane characteristics table. When you select old planes on the histogram, only these planes are mapped. However, if you attempt to build add a color measure on the map, you will not have access to the plane characteristics columns (because they are not joined).

Creating a Join

  1. Open a dashboard and select the chart type that you want to create; in this case, a Table.

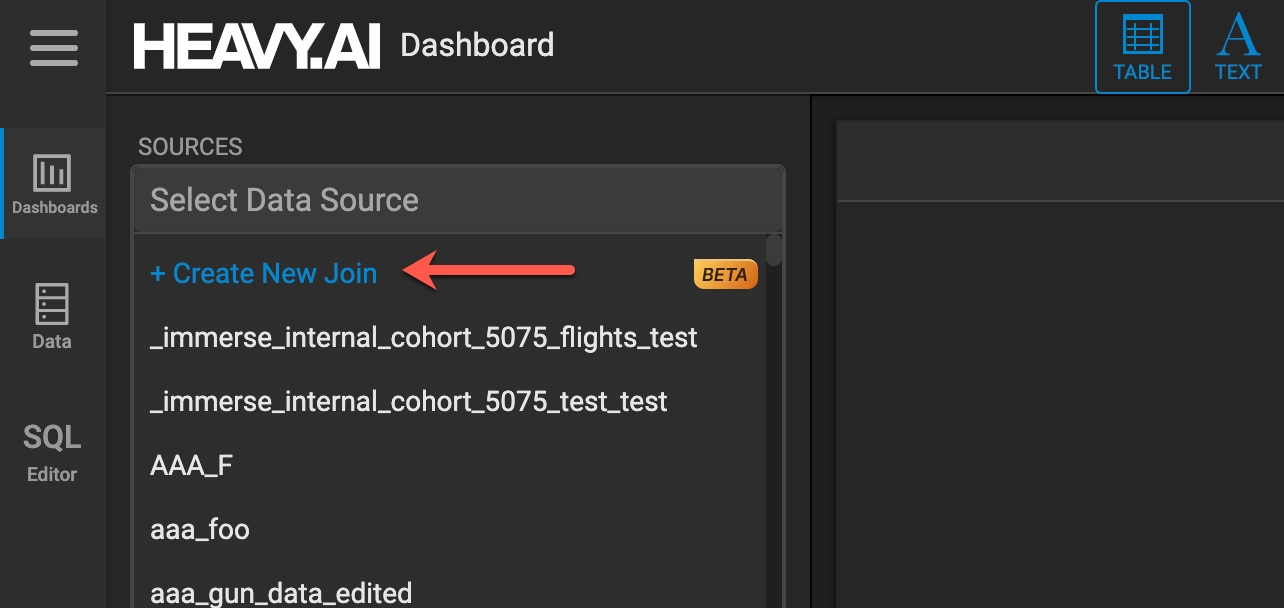
  2. Click Create New Join.

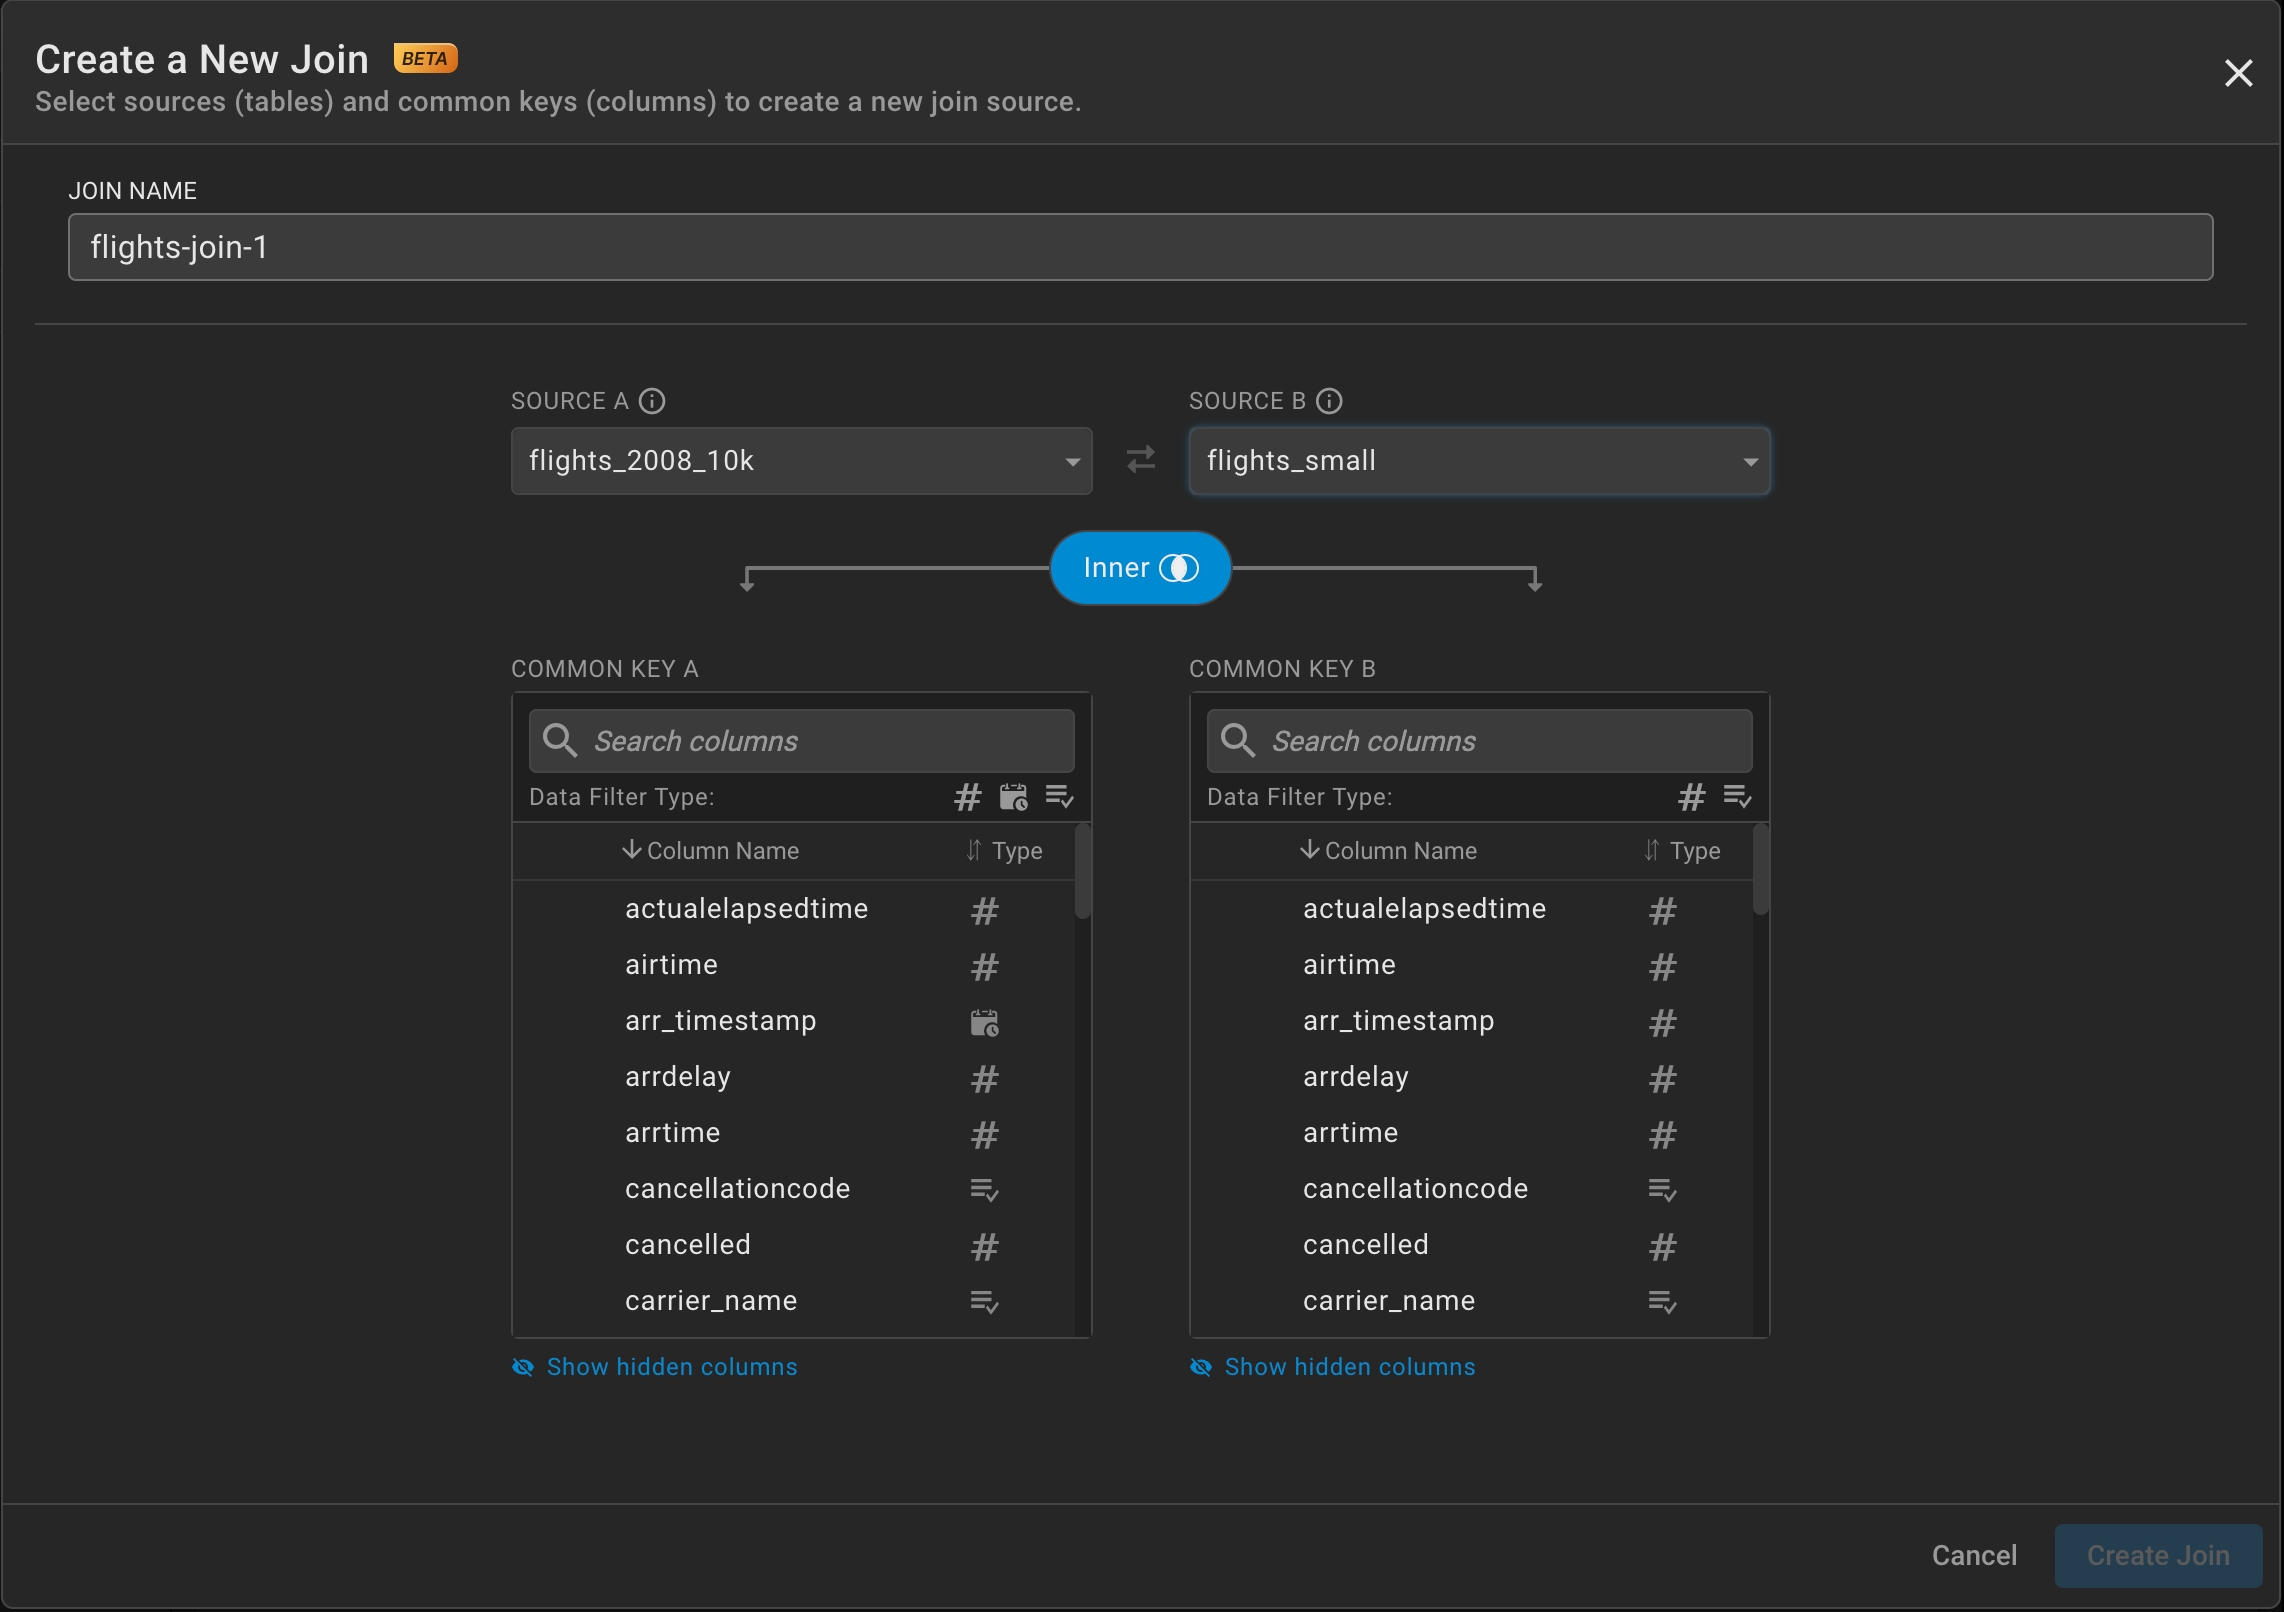
  1. In Create a New Join, name the join (flights-join-1), select the data sources: Source A (flights_2008_10k) and Source B (flights_small), and select the join type (in this example, Inner).
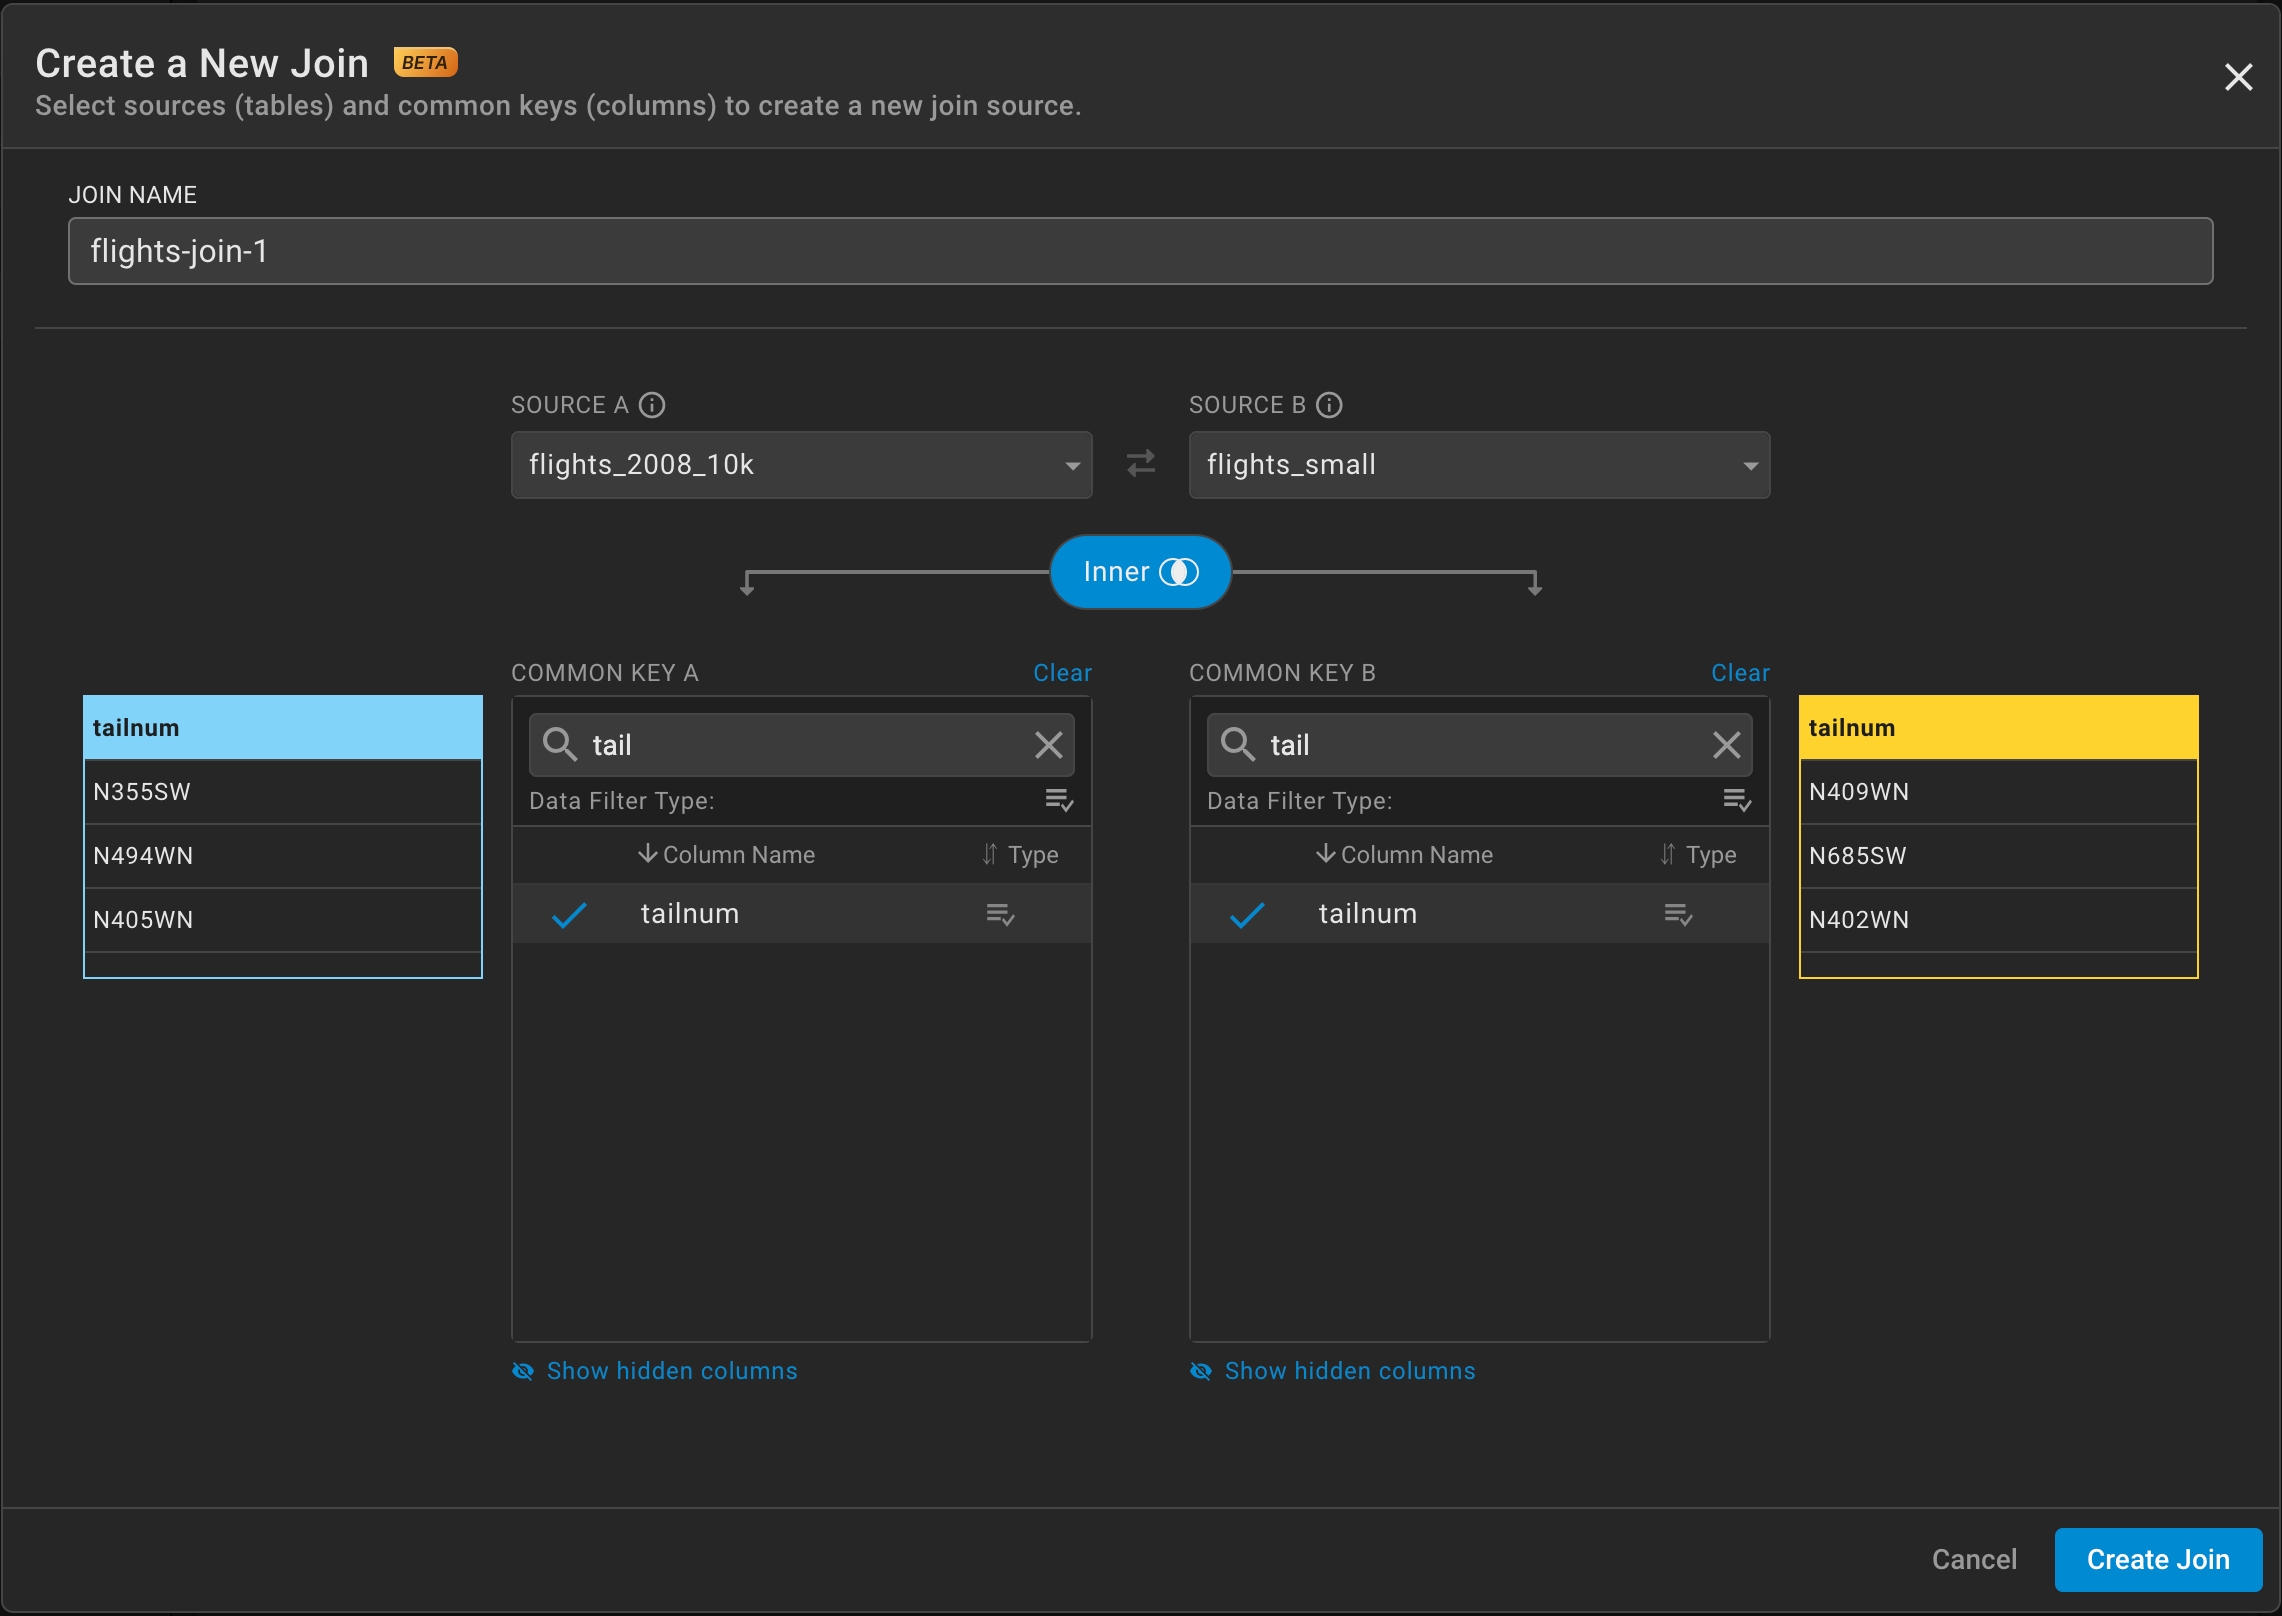
  1. Select Common Key A and Common Key B (in this case, tailnum for both) and click Create Join.
  1. Add the dimension (carrier_name here) for column 1 and the measure (Count #Records here) for column 2 to update the Table.

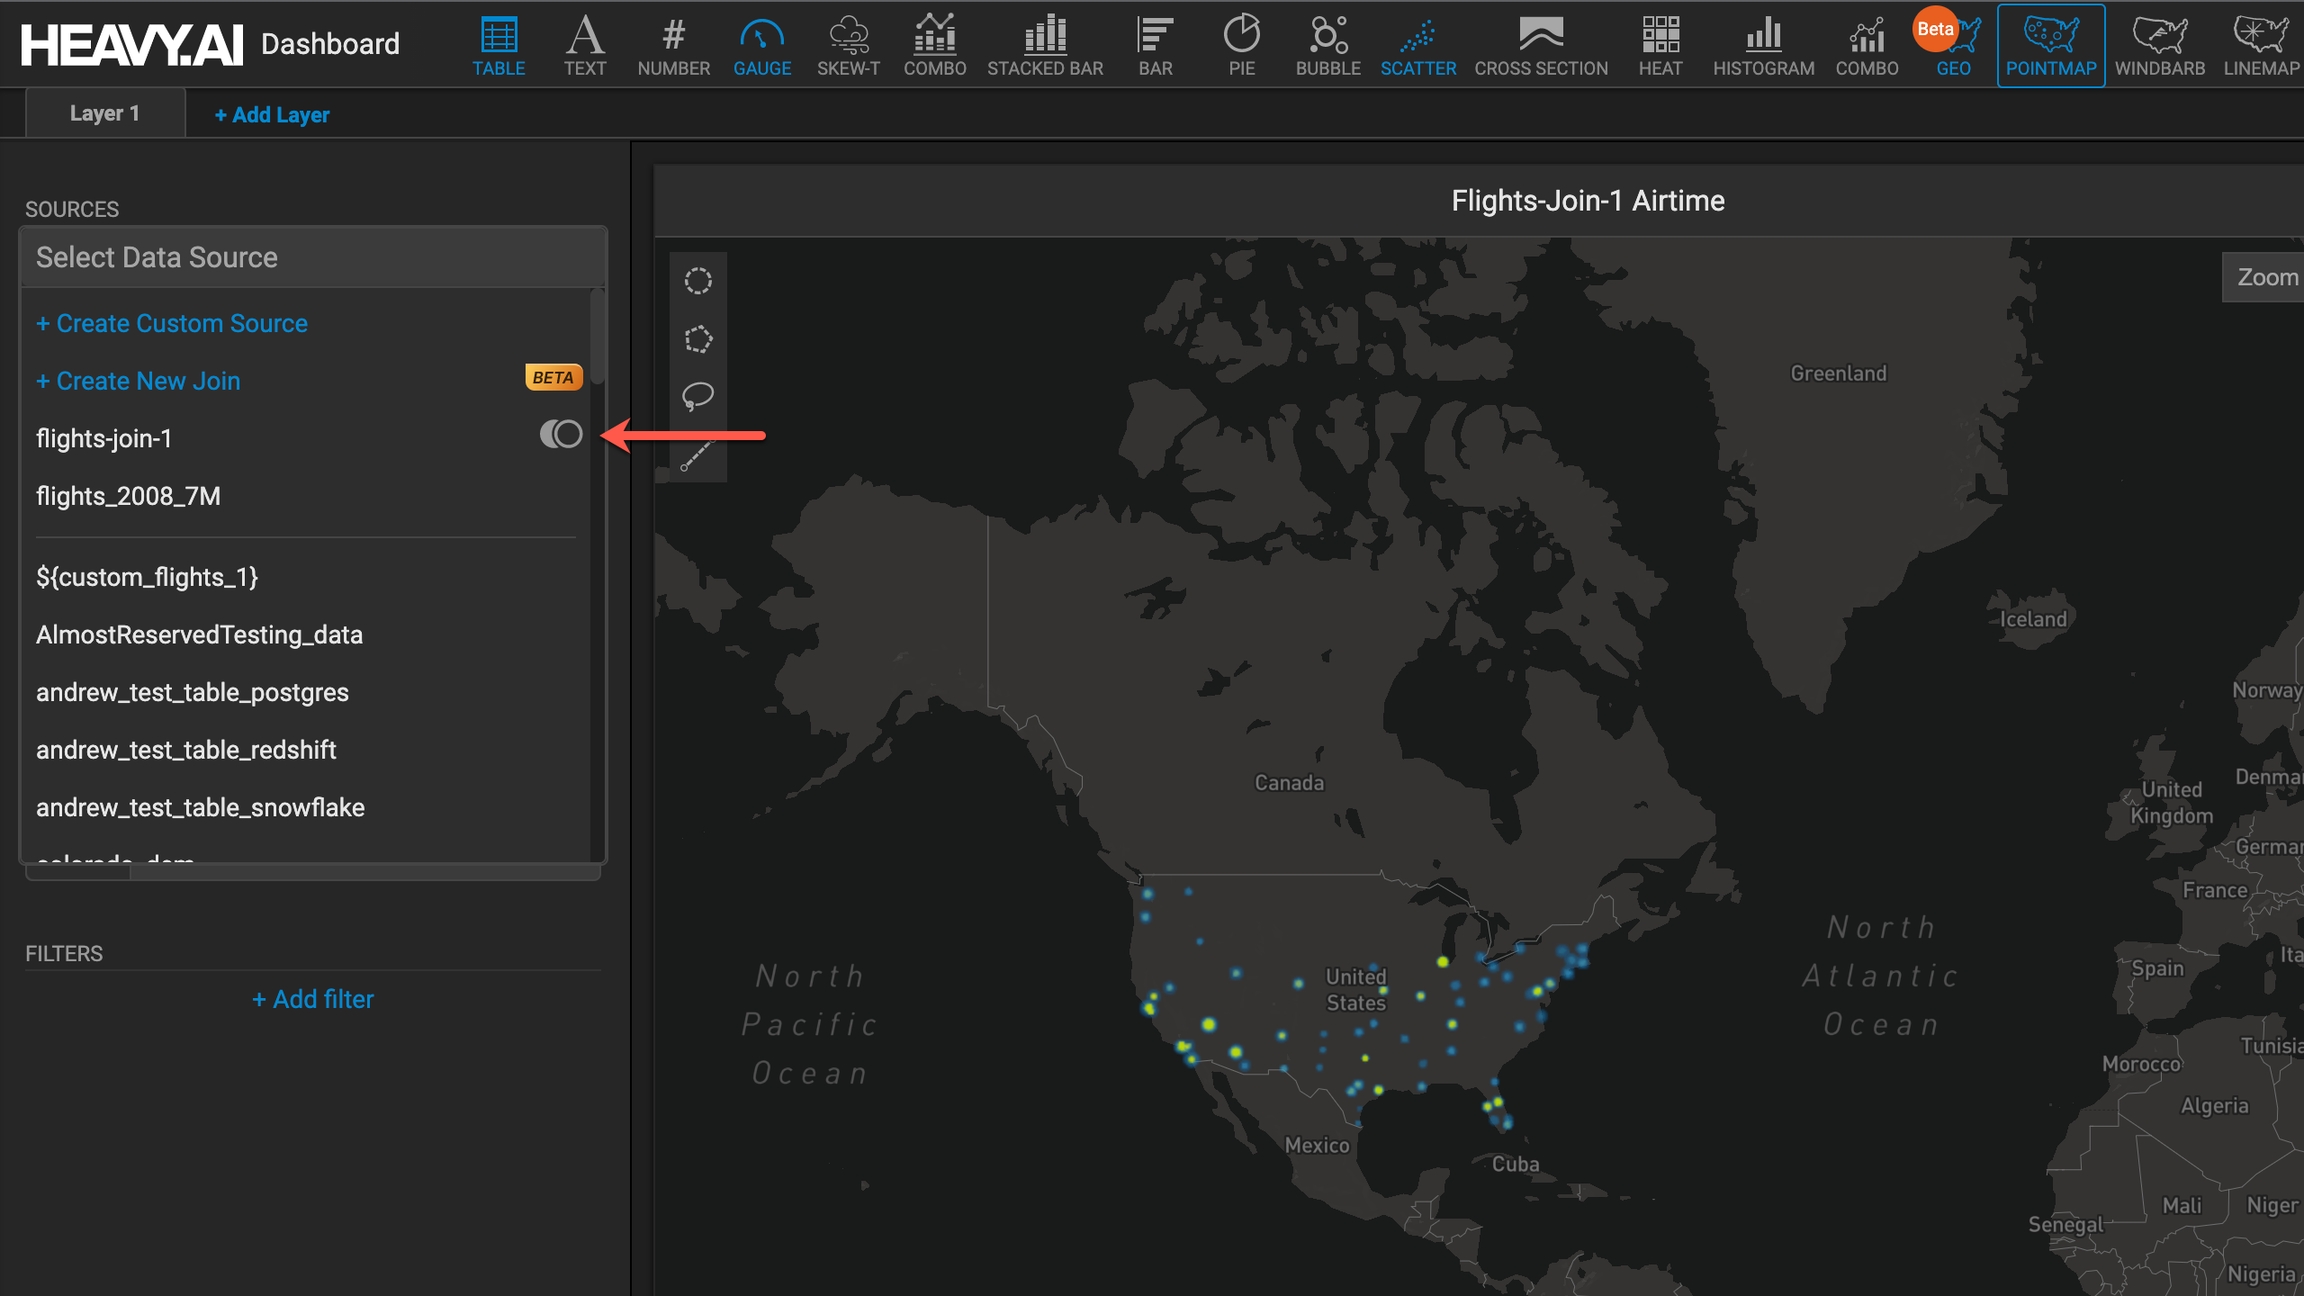
  1. You can use the join you just created as the source for other charts; the join icon denotes a join source. Here, the Pointmap is created using the flights-join-1 source, with Lon, Lat, and Size measures defined as shown:
Edit a Join

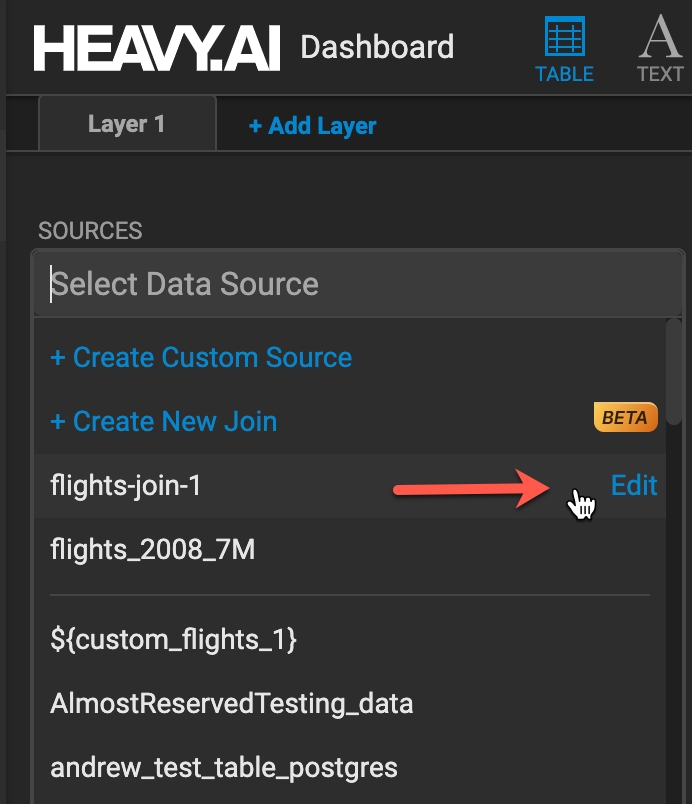
You can edit the join after you create it by hovering on the join and then clicking Edit.
Update a Join

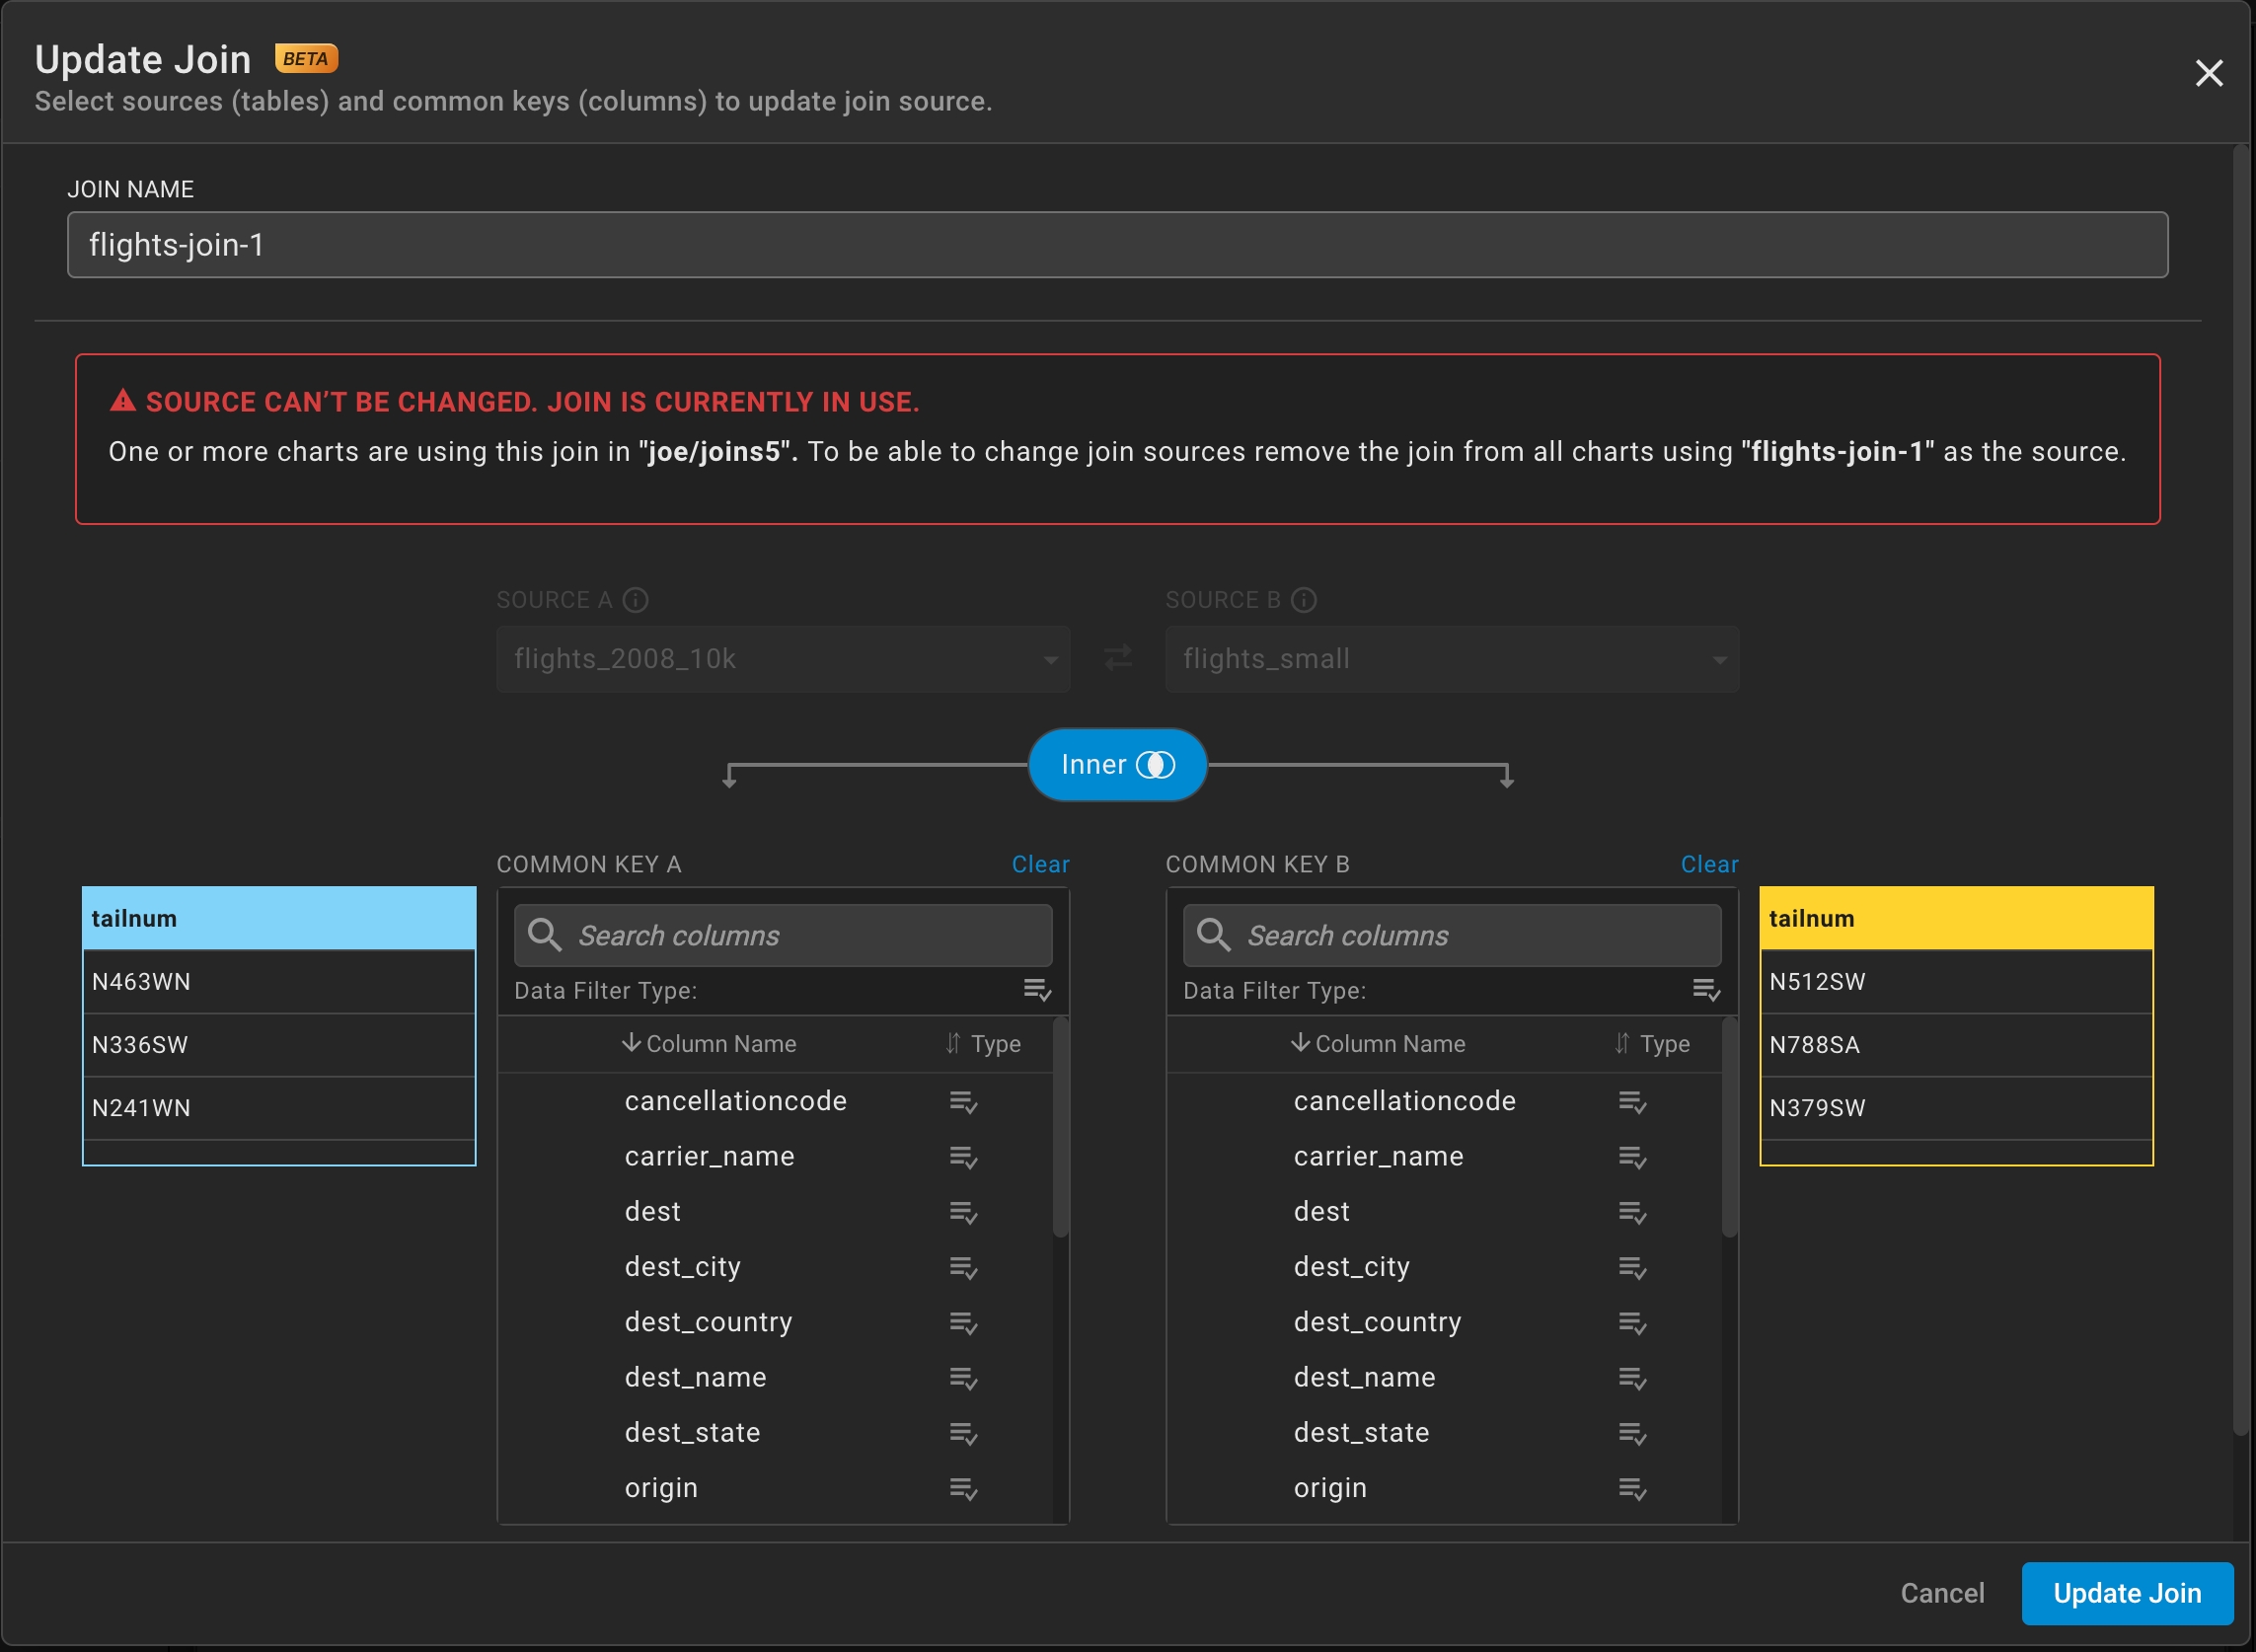
To update the join, you must first remove it from all charts using it as the source, make your changes, and then click Update Join.
ui/enable_joins
Editing an existing join which is in active use. You can alter join type or columns but not delete the join.