HEAVY.AI Docs
v8.1.0
v8.1.0
  • Welcome to HEAVY.AI Documentation
  • Overview
    • Overview
    • Release Notes
  • Installation and Configuration
    • System Requirements
      • Hardware Reference
      • Software Requirements
      • Licensing
    • Installation
      • Free Version
      • Installing on Docker
        • HEAVY.AI Installation using Docker on Ubuntu
      • Installing on Ubuntu
        • HEAVY.AI Installation on Ubuntu
        • Install NVIDIA Drivers and Vulkan on Ubuntu
      • Installing on Rocky Linux / RHEL
        • HEAVY.AI Installation on RHEL
        • Install NVIDIA Drivers and Vulkan on Rocky Linux and RHEL
      • Getting Started on AWS
      • Getting Started on GCP
      • Getting Started on Azure
      • Getting Started on Kubernetes (BETA)
      • Upgrading
        • Upgrading HEAVY.AI
        • Upgrading from Omnisci to HEAVY.AI 6.0
        • CUDA Compatibility Drivers
      • Uninstalling
      • Ports
    • Services and Utilities
      • Using Services
      • Using Utilities
    • Executor Resource Manager
    • Configuration Parameters
      • Overview
      • Configuration Parameters for HeavyDB
      • Configuration Parameters for HEAVY.AI Web Server
      • Configuration Parameters for HeavyIQ
    • Security
      • Roles and Privileges
        • Column-Level Security
      • Connecting Using SAML
      • Implementing a Secure Binary Interface
      • Encrypted Credentials in Custom Applications
      • LDAP Integration
    • Distributed Configuration
  • Loading and Exporting Data
    • Supported Data Sources
      • Kafka
      • Using HeavyImmerse Data Manager
      • Importing Geospatial Data
    • Command Line
      • Loading Data with SQL
      • Exporting Data
  • SQL
    • Data Definition (DDL)
      • Datatypes
      • Users and Databases
      • Tables
      • System Tables
      • Views
      • Policies
      • Comment
    • Data Manipulation (DML)
      • SQL Capabilities
        • ALTER SESSION SET
        • ALTER SYSTEM CLEAR
        • DELETE
        • EXPLAIN
        • INSERT
        • KILL QUERY
        • LIKELY/UNLIKELY
        • SELECT
        • SHOW
        • UPDATE
        • Arrays
        • Logical Operators and Conditional and Subquery Expressions
        • Table Expression and Join Support
        • Type Casts
      • Geospatial Capabilities
        • Uber H3 Hexagonal Modeling
      • Functions and Operators
      • System Table Functions
        • generate_random_strings
        • generate_series
        • tf_compute_dwell_times
        • tf_feature_self_similarity
        • tf_feature_similarity
        • tf_geo_rasterize
        • tf_geo_rasterize_slope
        • tf_graph_shortest_path
        • tf_graph_shortest_paths_distances
        • tf_load_point_cloud
        • tf_mandelbrot*
        • tf_point_cloud_metadata
        • tf_raster_contour_lines; tf_raster_contour_polygons
        • tf_raster_graph_shortest_slope_weighted_path
        • tf_rf_prop_max_signal (Directional Antennas)
        • ts_rf_prop_max_signal (Isotropic Antennas)
        • tf_rf_prop
      • Window Functions
      • Reserved Words
      • SQL Extensions
      • HeavyIQ LLM_TRANSFORM
  • HeavyImmerse
    • Introduction to HeavyImmerse
    • Admin Portal
    • Control Panel
    • Working with Dashboards
      • Dashboard List
      • Creating a Dashboard
      • Configuring a Dashboard
      • Duplicating and Sharing Dashboards
    • Measures and Dimensions
    • Using Parameters
    • Using Filters
    • Using Cross-link
    • Chart Animation
    • Multilayer Charts
    • SQL Editor
    • Customization
    • Joins (Beta)
    • Chart Types
      • Overview
      • Bubble
      • Choropleth
      • Combo
      • Contour
      • Cross-Section
      • Gauge
      • Geo Heatmap
      • Heatmap
      • Linemap
      • Number
      • Pie
      • Pointmap
      • Scatter Plot
      • Skew-T
      • Table
      • Text Widget
      • Wind Barb
    • Deprecated Charts
      • Bar
      • Combo - Original
      • Histogram
      • Line
      • Stacked Bar
    • HeavyIQ SQL Notebook
  • HEAVYIQ Conversational Analytics
    • HeavyIQ Overview
      • HeavyIQ Guidance
  • HeavyRF
    • Introduction to HeavyRF
    • Getting Started
    • HeavyRF Table Functions
  • HeavyConnect
    • HeavyConnect Release Overview
    • Getting Started
    • Best Practices
    • Examples
    • Command Reference
    • Parquet Data Wrapper Reference
    • ODBC Data Wrapper Reference
    • Raster Data Wrapper Reference
  • HeavyML (BETA)
    • HeavyML Overview
    • Clustering Algorithms
    • Regression Algorithms
      • Linear Regression
      • Random Forest Regression
      • Decision Tree Regression
      • Gradient Boosting Tree Regression
    • Principal Components Analysis
  • Python / Data Science
    • Data Science Foundation
    • JupyterLab Installation and Configuration
    • Using HEAVY.AI with JupyterLab
    • Python User-Defined Functions (UDFs) with the Remote Backend Compiler (RBC)
      • Installation
      • Registering and Using a Function
      • User-Defined Table Functions
      • RBC UDF/UDTF Example Notebooks
      • General UDF/UDTF Tutorial Notebooks
      • RBC API Reference
    • Ibis
    • Interactive Data Exploration with Altair
    • Additional Examples
      • Forecasting with HEAVY.AI and Prophet
  • APIs and Interfaces
    • Overview
    • heavysql
    • Thrift
    • JDBC
    • ODBC
    • Vega
      • Vega Tutorials
        • Vega at a Glance
        • Getting Started with Vega
        • Getting More from Your Data
        • Creating More Advanced Charts
        • Using Polys Marks Type
        • Vega Accumulator
        • Using Transform Aggregation
        • Improving Rendering with SQL Extensions
      • Vega Reference Overview
        • data Property
        • projections Property
        • scales Property
        • marks Property
      • Migration
        • Migrating Vega Code to Dynamic Poly Rendering
      • Try Vega
    • RJDBC
    • SQuirreL SQL
    • heavyai-connector
  • Tutorials and Demos
    • Loading Data
    • Using Heavy Immerse
    • Hello World
    • Creating a Kafka Streaming Application
    • Getting Started with Open Source
    • Try Vega
  • Troubleshooting and Special Topics
    • FAQs
    • Troubleshooting
    • Vulkan Renderer
    • Optimizing
    • Known Issues and Limitations
    • Logs and Monitoring
    • Archived Release Notes
      • Release 6.x
      • Release 5.x
      • Release 4.x
      • Release 3.x
Powered by GitBook
On this page
  • Managing cross-links
  • Create a cross-link
  • Editing a cross-link
  • Advanced Usage
  • Multiple cross-links
  • Multiple Column Match
Export as PDF
  1. HeavyImmerse

Using Cross-link

Cross-link provides a no code interface for you to link two datasources by one or multiple columns. Immerse can then automatically crossfilter between datasources using cross-links.

PreviousUsing FiltersNextChart Animation

Last updated 11 months ago

Cross-links or Joins

  • A join is a new datasource that performs a SQL join. Columns from both tables can be queried and used in one or many charts.

  • A cross-link pertains only to filtering. By specifying cross-linked columns, you can automatically apply filters applied to one dataset, to another.

Managing cross-links

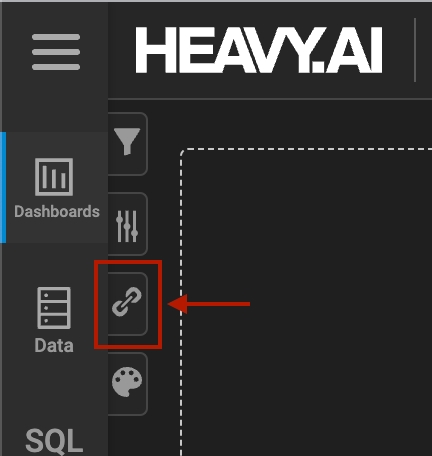
Begin by selecting the cross-link tab in the dashboard view
Create a cross-link

To create a cross-link, select the "Setup cross-link" button.
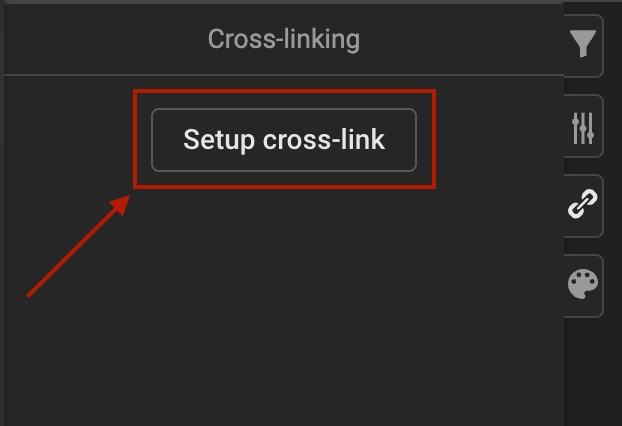
This opens the cross-link creation form
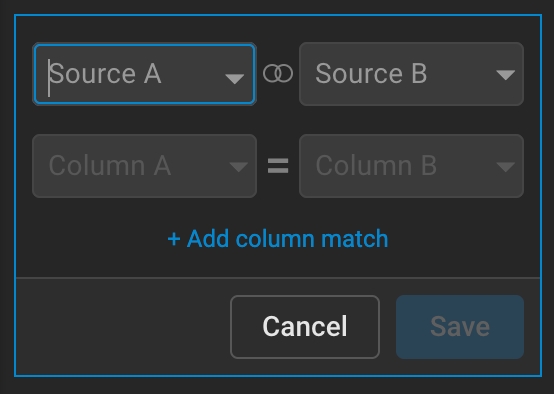
The components of a cross-link are exactly two datasources and one or more sets of columns from each datasource to link. Click "Save" to save and apply the crosslink to the current dashboard.
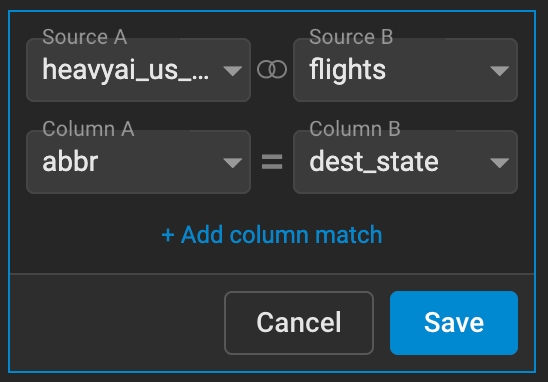
In the above scenario a crosslink is setup between the datasource heavyai_us_states,column abbr and datasource flights, column dest_state. This means that if you crossfilter a chart that uses datasource heavyai_us_states immerse will automatically crossfilter any charts that use the flights table to contain only records where dest_state matches the abbr column from the filtered heavyai_us_states chart.

In the full example below, a crosslink is setup as described above. The US States chart is crossfiltering to records only containing the abbr of CO. On the right are two charts showing flight data in a point map and in a table grouped by state. Because of the cross-link, these two charts are only showing records with a dest_state that equals CO.

Note: Cross-links go both ways, so in our example if I filter heavyai_us_states by an abbr of CO it will filter the flights table by a dest_state of CO, but if I filter flights by a dest_state of CO it will also filter the heavyai_us_states chart by an abbr of CO.

Editing a cross-link

Once a cross-link is saved, you can access other actions like "Edit a cross-link" by selecting the ellipses in the upper right corner, which appear on hover.

From here you can select Edit or Delete actions. Selecting edit will enable edit mode where you can select datasources and update or add columns. You have the option to Save or Cancel your changes.

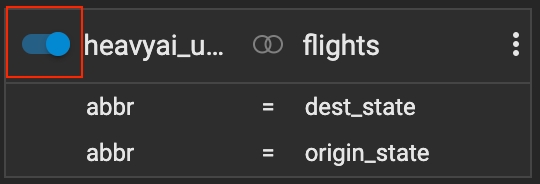
You can toggle cross-links on and off using the toggle switch in the upper left corner.
Advanced Usage

For more complex use cases you can set up multiple cross-links or create cross-links with multiple sets of columns

Multiple cross-links

If you have many datasources in a dashboard, you can also setup multiple cross-links between them.
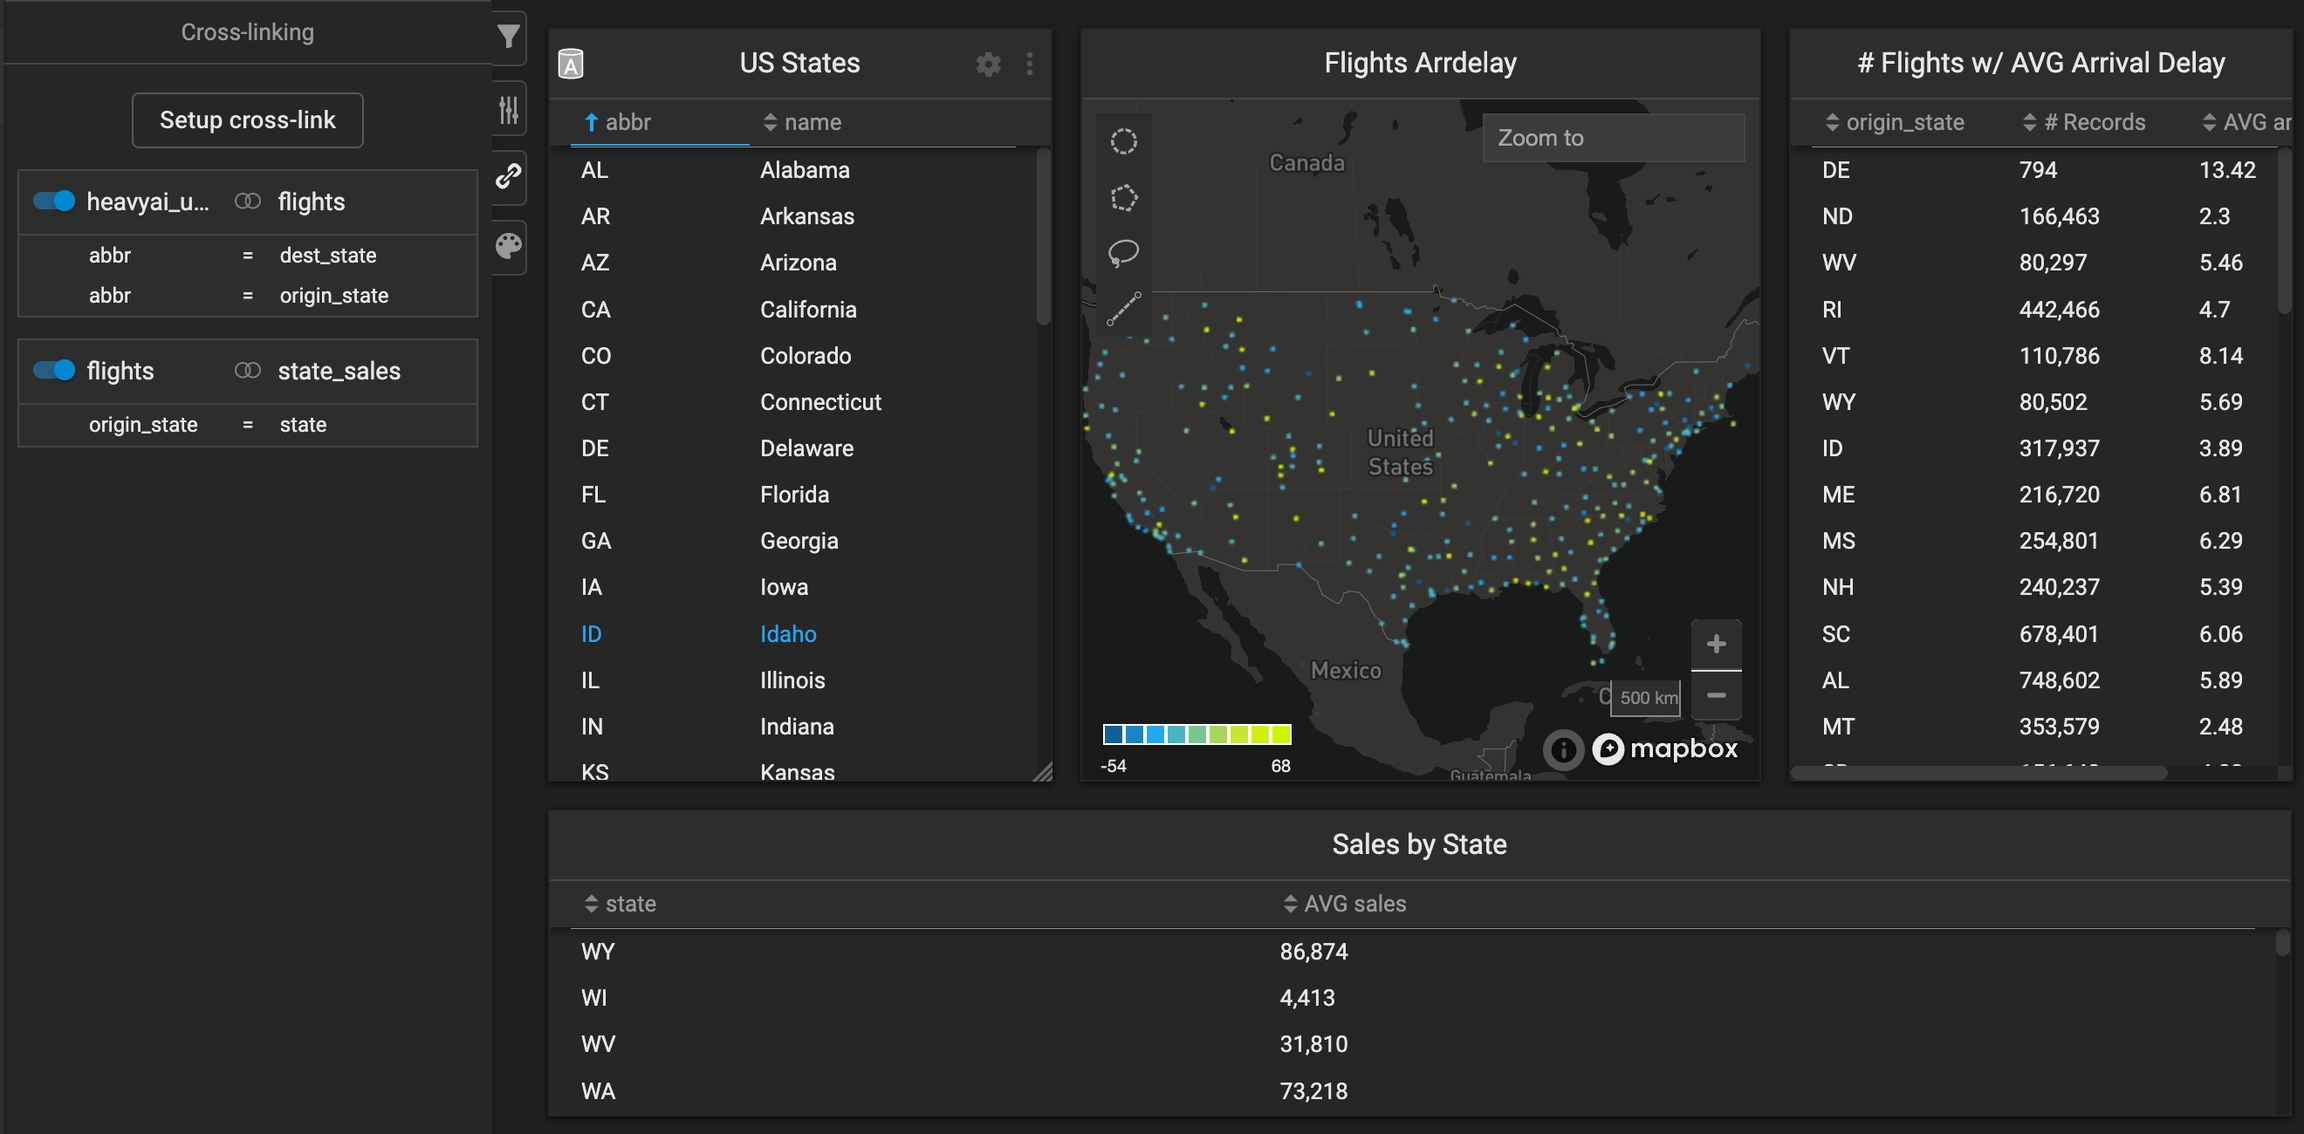
In the above dashboard we have added a chart with a third datasource sales and setup a cross-link between the origin_state of the flights table with the statecolumn of the sales table.

Scenario 1: Selecting "CO" of the US States chart

In this scenario the two charts that use the flights table will be filtered by dest_state and origin_state equal to CO but the Sales by State table will not also be filtered by state equals CO.

Scenario 2: Selecting the row with origin_state of CO in the "# Flights" chart

In this scenario both the Sales by State and US States tables will be filtered, because there is a crosslink setup between the flights table and both the heavyai_us_states and the sales tables.

Cross-links do not chain. The above scenario only works because the flights table is being filtered, which is cross-linked to both other tables. Filtering heavyai_us_states for example would not filter flights AND state_sales, it would only filter the flights table

Multiple Column Match

To add additional sets of columns to cross-link on, click the "Add column match" link when editing a cross-link.
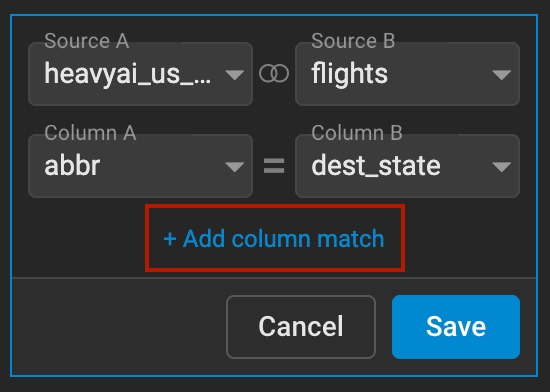
This will add an additional row of columns, where you can select an additional column to link.
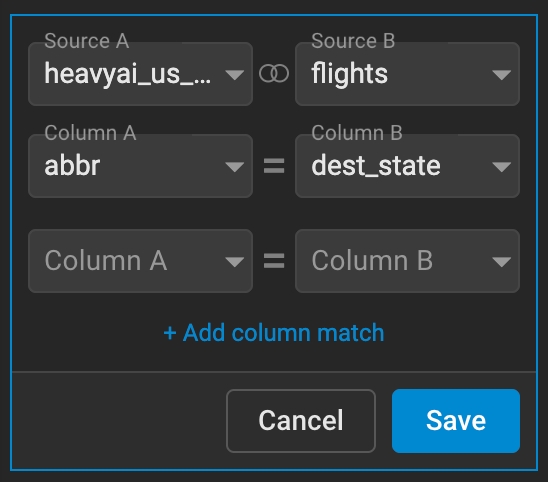
In our example, if we wanted the CO crossfilter to filter both dest_state and origin_state we could add an additional column match for this.
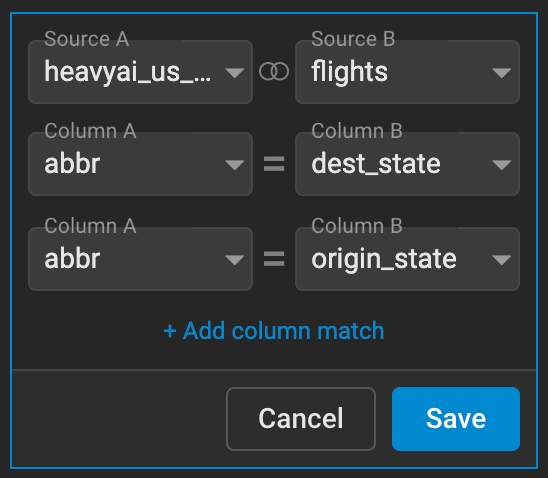
Now if we filter heavy_ai_states by an abbr of CO, Immerse will only show us flights that departed and landed in Colorado in the charts that use the flights datasource.

You can add as many column matches as you would like.

Charts with different datasources, cross-linked and cross-filtered