Cross-Section
Cross-section charts have long been used in architecture, engineering, and the sciences. Now, GPU analytics have the memory capacity and speed to create cross-section charts interactively on big geotemporal datasets.
Multidimensional array data such as the output from weather models or seismic surveys typically contains estimates or observations of properties at multiple vertical elevations. Cross sections provide a way to cut into a three dimensional volume and visualize its internal structure. For example, surface winds can vary from winds aloft, which can cause turbulence or wind shear dangerous for aviation. Subsurface properties also vary significantly, which is important in assessing both aquifers and oil reservoirs.
A cross section is slightly more difficult to specify than some other chart types because there can be a nearly-infinite number of cross sections drawn within a volume. The location of the sections must be specified on a map chart, and the line tool provides a simple and quick way of doing so. The visualization properties of the section are set in the contour chart itself. You can add the charts in any order, but you must have a map chart on your dashboard before you can complete the full specification of an interactive cross-section.
Enabling the "ui/enable_cross_section_chart" flag adds a new cross-section chart type, and also adds a new cross-section line tool to the existing draw tool menu on map charts.
The following figure shows the cross-section line tool on a Pointmap:
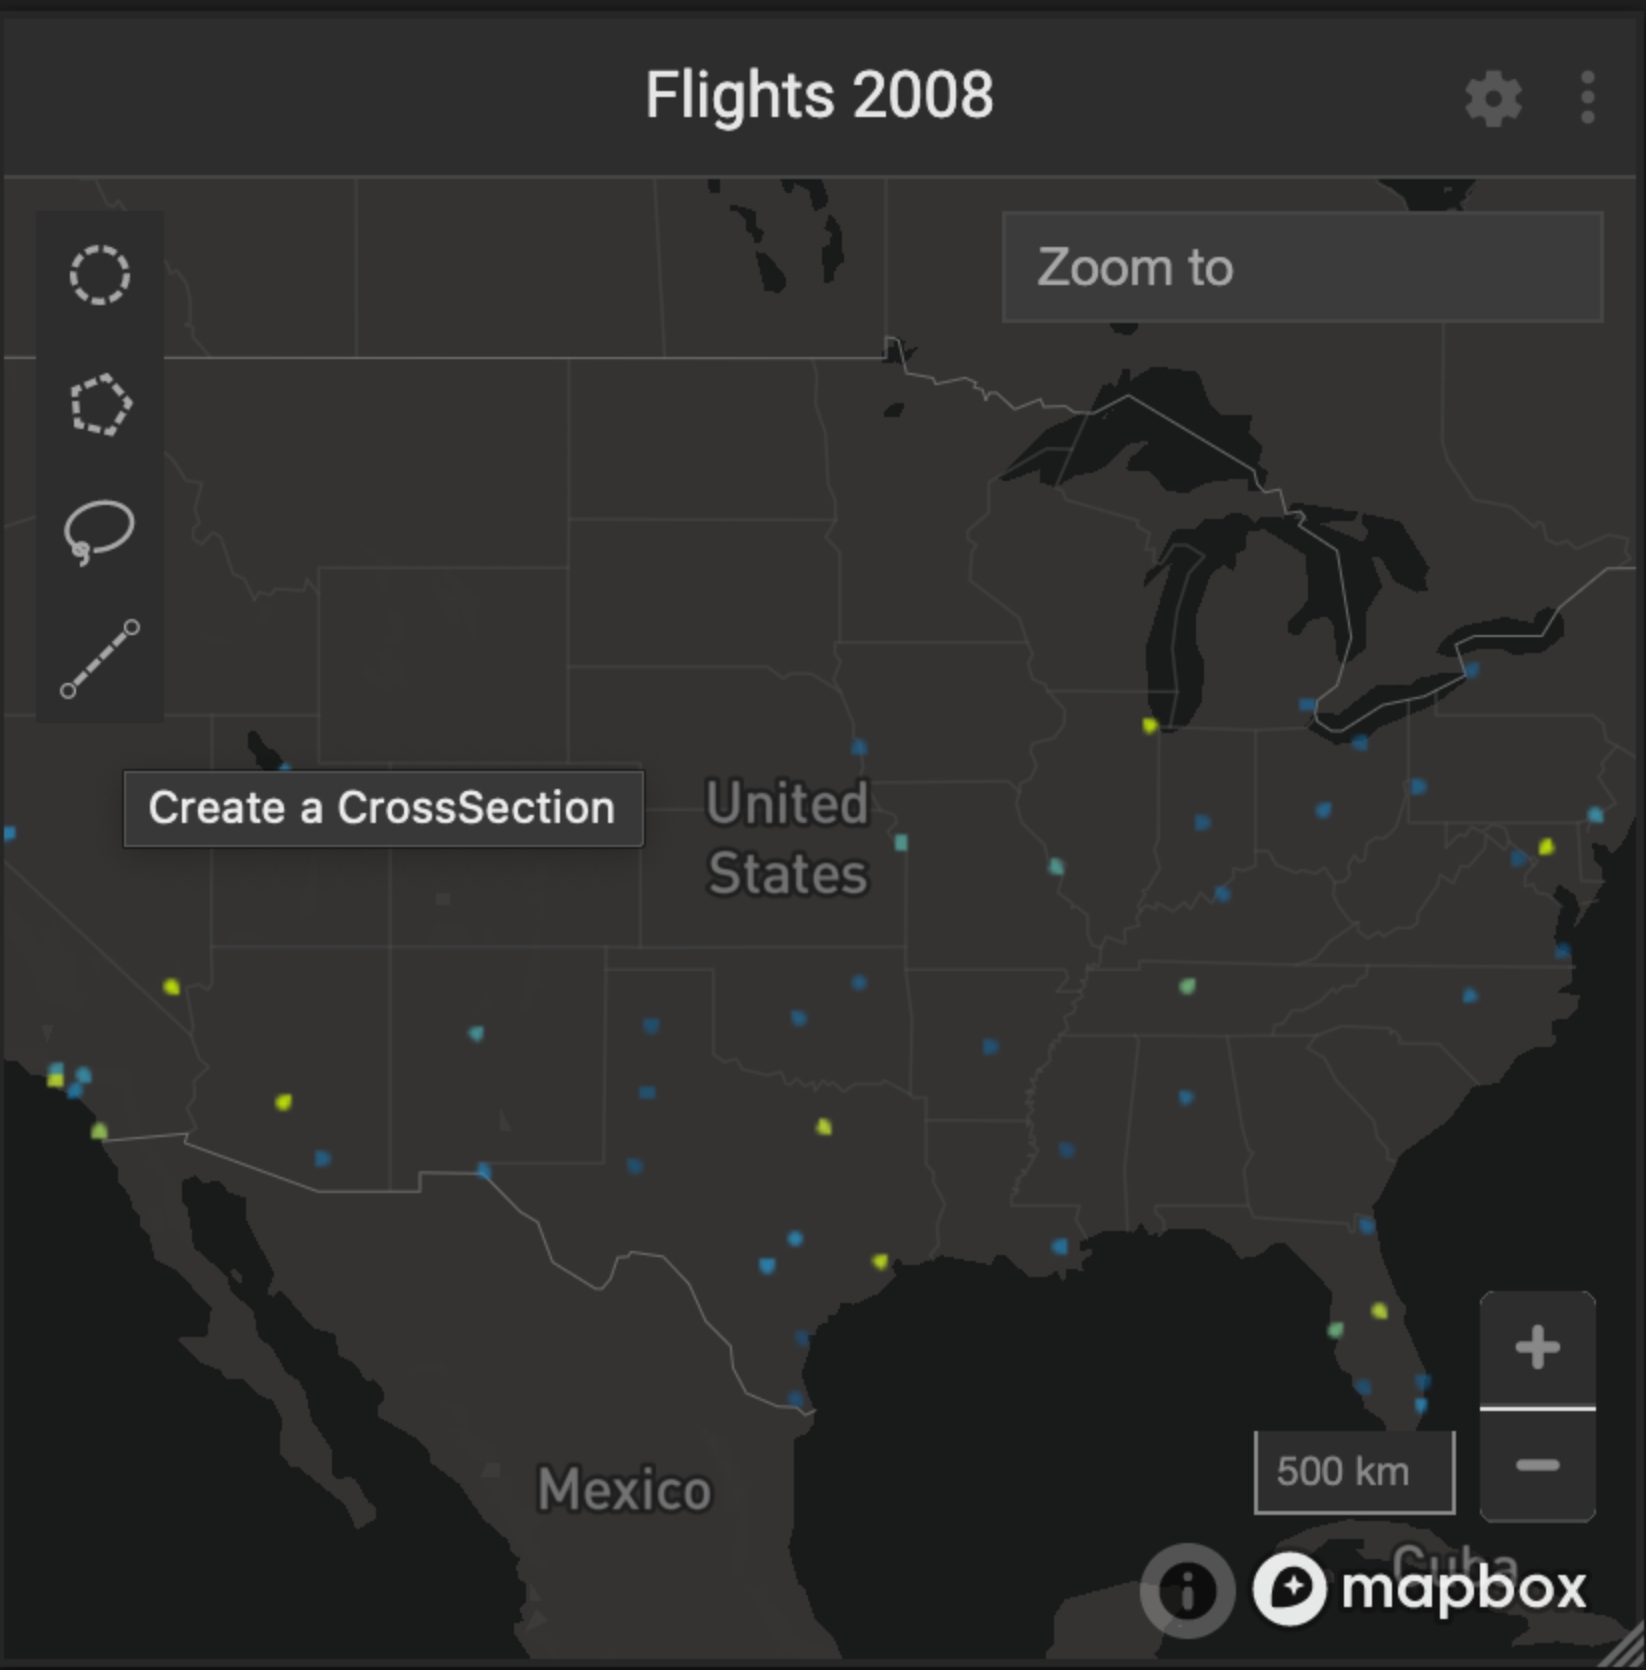
Creating a Cross Section
To create a cross section, on any existing map chart, such as a Pointmap, use the line tool to define a transect to be used as the x axis for the cross-section chart. You can draw one two-point line on a chart; click to mark start and endpoints.
You can edit the line, similar to other draw tools, by selecting and dragging.
When creating a Cross-section chart, any lines that were defined appear under the Sections dropdown, listed by chart ID. The following figure shows a Cross-section chart defined using a line in the chart above.
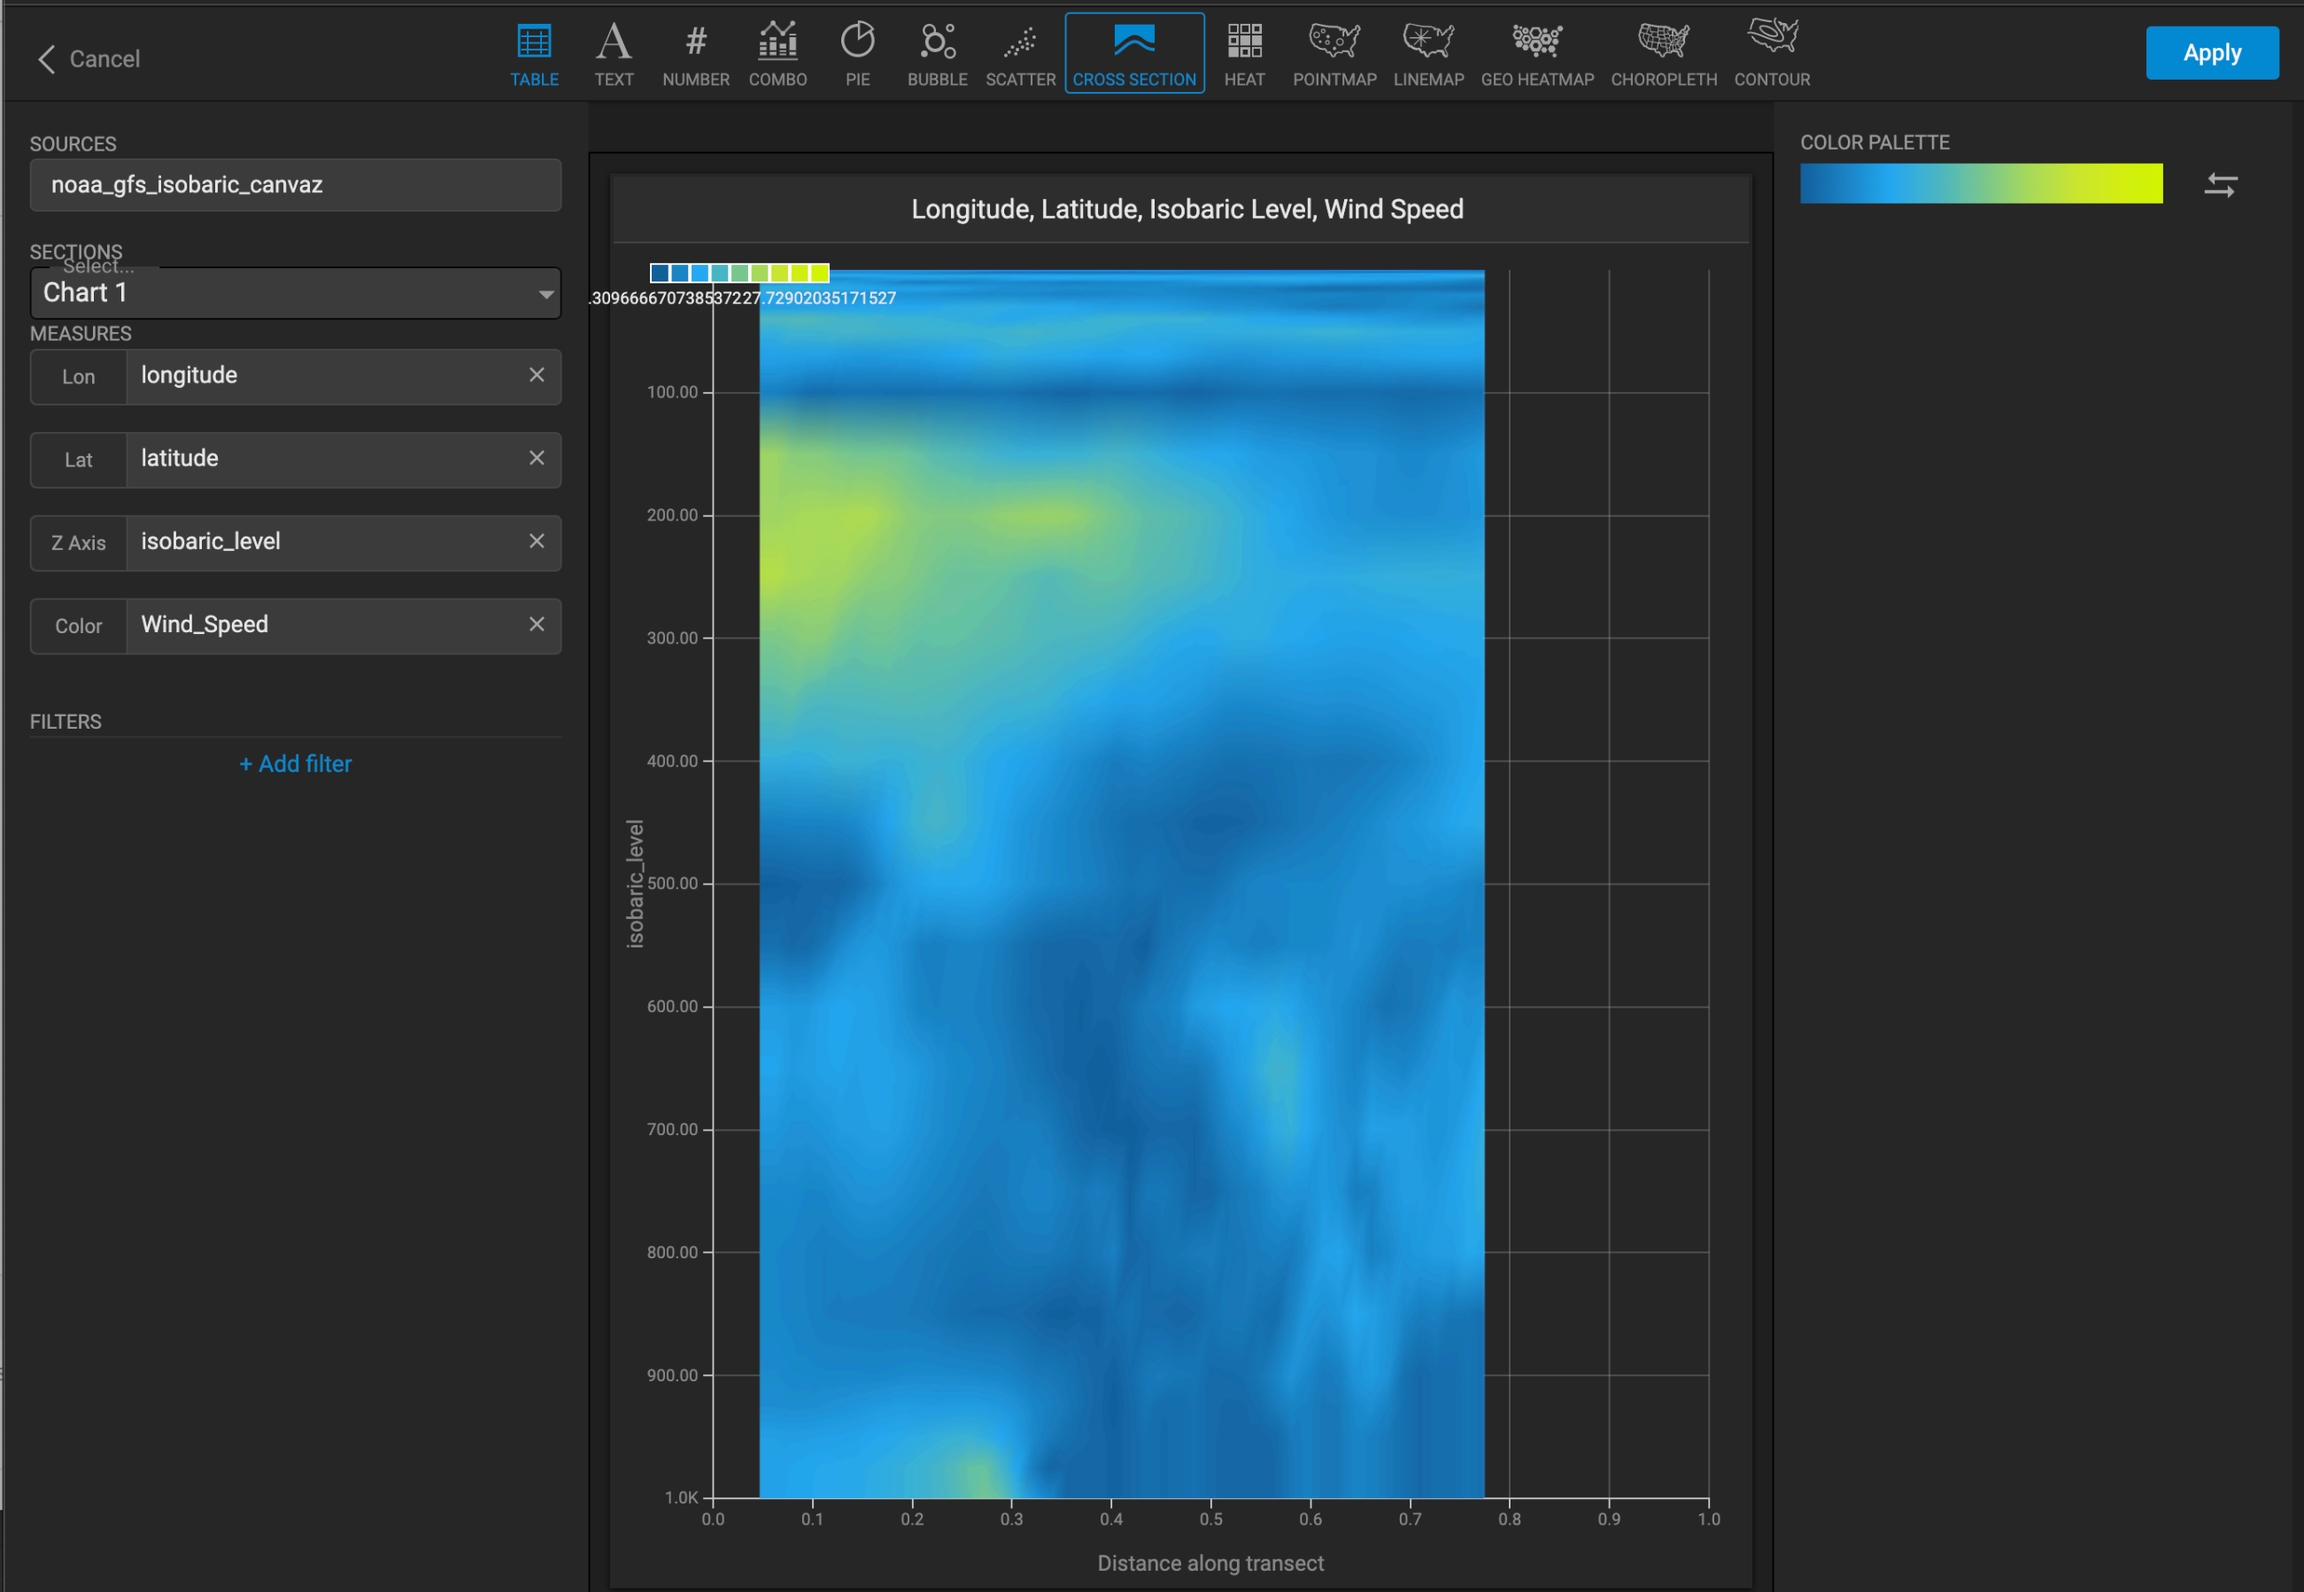
If a line is selected, the horizontal axis of the Cross-section chart represents the normalized distance along the selected line.
If no line is selected, the initial default x axis of the chart represents a northward view from the south edge of the map, as if a selection had already been drawn from the bottom left to bottom right of the map view.
Creating a line also creates read-only latitude/longitude parameters for the start and endpoints; these auto-generated parameters appear in the parameter panel if they are used in a cross section chart.
The Z axis measure defines the vertical axis.
Data Validation
To render a cross section, the entire volume of data must be equally spaced:
The entire volume must be rectilinear; see https://en.wikipedia.org/wiki/File:Rectilinear_grid.svg.
The lat/lon plane must be regular; that is, equal spacing in both dimensions. See https://en.wikipedia.org/wiki/Regular_grid#/media/File:Regular_grid.svg.
There must be one unique sample point for every voxel in the volume. For example, if you are defining an x/y/z volume with columns lon/lat/isobaric_level, there can be only one row in the query result with the values
lon:-100, lat:35, isobaric_level:1000.
If the data fails validation, the chart will fail to render and display an error indicating which requirement failed.
Last updated