HEAVY.AI Docs
v8.1.0
v8.1.0
  • Welcome to HEAVY.AI Documentation
  • Overview
    • Overview
    • Release Notes
  • Installation and Configuration
    • System Requirements
      • Hardware Reference
      • Software Requirements
      • Licensing
    • Installation
      • Free Version
      • Installing on Docker
        • HEAVY.AI Installation using Docker on Ubuntu
      • Installing on Ubuntu
        • HEAVY.AI Installation on Ubuntu
        • Install NVIDIA Drivers and Vulkan on Ubuntu
      • Installing on Rocky Linux / RHEL
        • HEAVY.AI Installation on RHEL
        • Install NVIDIA Drivers and Vulkan on Rocky Linux and RHEL
      • Getting Started on AWS
      • Getting Started on GCP
      • Getting Started on Azure
      • Getting Started on Kubernetes (BETA)
      • Upgrading
        • Upgrading HEAVY.AI
        • Upgrading from Omnisci to HEAVY.AI 6.0
        • CUDA Compatibility Drivers
      • Uninstalling
      • Ports
    • Services and Utilities
      • Using Services
      • Using Utilities
    • Executor Resource Manager
    • Configuration Parameters
      • Overview
      • Configuration Parameters for HeavyDB
      • Configuration Parameters for HEAVY.AI Web Server
      • Configuration Parameters for HeavyIQ
    • Security
      • Roles and Privileges
        • Column-Level Security
      • Connecting Using SAML
      • Implementing a Secure Binary Interface
      • Encrypted Credentials in Custom Applications
      • LDAP Integration
    • Distributed Configuration
  • Loading and Exporting Data
    • Supported Data Sources
      • Kafka
      • Using HeavyImmerse Data Manager
      • Importing Geospatial Data
    • Command Line
      • Loading Data with SQL
      • Exporting Data
  • SQL
    • Data Definition (DDL)
      • Datatypes
      • Users and Databases
      • Tables
      • System Tables
      • Views
      • Policies
      • Comment
    • Data Manipulation (DML)
      • SQL Capabilities
        • ALTER SESSION SET
        • ALTER SYSTEM CLEAR
        • DELETE
        • EXPLAIN
        • INSERT
        • KILL QUERY
        • LIKELY/UNLIKELY
        • SELECT
        • SHOW
        • UPDATE
        • Arrays
        • Logical Operators and Conditional and Subquery Expressions
        • Table Expression and Join Support
        • Type Casts
      • Geospatial Capabilities
        • Uber H3 Hexagonal Modeling
      • Functions and Operators
      • System Table Functions
        • generate_random_strings
        • generate_series
        • tf_compute_dwell_times
        • tf_feature_self_similarity
        • tf_feature_similarity
        • tf_geo_rasterize
        • tf_geo_rasterize_slope
        • tf_graph_shortest_path
        • tf_graph_shortest_paths_distances
        • tf_load_point_cloud
        • tf_mandelbrot*
        • tf_point_cloud_metadata
        • tf_raster_contour_lines; tf_raster_contour_polygons
        • tf_raster_graph_shortest_slope_weighted_path
        • tf_rf_prop_max_signal (Directional Antennas)
        • ts_rf_prop_max_signal (Isotropic Antennas)
        • tf_rf_prop
      • Window Functions
      • Reserved Words
      • SQL Extensions
      • HeavyIQ LLM_TRANSFORM
  • HeavyImmerse
    • Introduction to HeavyImmerse
    • Admin Portal
    • Control Panel
    • Working with Dashboards
      • Dashboard List
      • Creating a Dashboard
      • Configuring a Dashboard
      • Duplicating and Sharing Dashboards
    • Measures and Dimensions
    • Using Parameters
    • Using Filters
    • Using Cross-link
    • Chart Animation
    • Multilayer Charts
    • SQL Editor
    • Customization
    • Joins (Beta)
    • Chart Types
      • Overview
      • Bubble
      • Choropleth
      • Combo
      • Contour
      • Cross-Section
      • Gauge
      • Geo Heatmap
      • Heatmap
      • Linemap
      • Number
      • Pie
      • Pointmap
      • Scatter Plot
      • Skew-T
      • Table
      • Text Widget
      • Wind Barb
    • Deprecated Charts
      • Bar
      • Combo - Original
      • Histogram
      • Line
      • Stacked Bar
    • HeavyIQ SQL Notebook
  • HEAVYIQ Conversational Analytics
    • HeavyIQ Overview
      • HeavyIQ Guidance
  • HeavyRF
    • Introduction to HeavyRF
    • Getting Started
    • HeavyRF Table Functions
  • HeavyConnect
    • HeavyConnect Release Overview
    • Getting Started
    • Best Practices
    • Examples
    • Command Reference
    • Parquet Data Wrapper Reference
    • ODBC Data Wrapper Reference
    • Raster Data Wrapper Reference
  • HeavyML (BETA)
    • HeavyML Overview
    • Clustering Algorithms
    • Regression Algorithms
      • Linear Regression
      • Random Forest Regression
      • Decision Tree Regression
      • Gradient Boosting Tree Regression
    • Principal Components Analysis
  • Python / Data Science
    • Data Science Foundation
    • JupyterLab Installation and Configuration
    • Using HEAVY.AI with JupyterLab
    • Python User-Defined Functions (UDFs) with the Remote Backend Compiler (RBC)
      • Installation
      • Registering and Using a Function
      • User-Defined Table Functions
      • RBC UDF/UDTF Example Notebooks
      • General UDF/UDTF Tutorial Notebooks
      • RBC API Reference
    • Ibis
    • Interactive Data Exploration with Altair
    • Additional Examples
      • Forecasting with HEAVY.AI and Prophet
  • APIs and Interfaces
    • Overview
    • heavysql
    • Thrift
    • JDBC
    • ODBC
    • Vega
      • Vega Tutorials
        • Vega at a Glance
        • Getting Started with Vega
        • Getting More from Your Data
        • Creating More Advanced Charts
        • Using Polys Marks Type
        • Vega Accumulator
        • Using Transform Aggregation
        • Improving Rendering with SQL Extensions
      • Vega Reference Overview
        • data Property
        • projections Property
        • scales Property
        • marks Property
      • Migration
        • Migrating Vega Code to Dynamic Poly Rendering
      • Try Vega
    • RJDBC
    • SQuirreL SQL
    • heavyai-connector
  • Tutorials and Demos
    • Loading Data
    • Using Heavy Immerse
    • Hello World
    • Creating a Kafka Streaming Application
    • Getting Started with Open Source
    • Try Vega
  • Troubleshooting and Special Topics
    • FAQs
    • Troubleshooting
    • Vulkan Renderer
    • Optimizing
    • Known Issues and Limitations
    • Logs and Monitoring
    • Archived Release Notes
      • Release 6.x
      • Release 5.x
      • Release 4.x
      • Release 3.x
Powered by GitBook
On this page
  • Clone
  • Connect
  • Retrieve
  • Display
Export as PDF
  1. Tutorials and Demos

Hello World

While you can immediately begin to analyze your data using Heavy Immerse, you might choose to create your own interface and custom charts.

PreviousUsing Heavy ImmerseNextCreating a Kafka Streaming Application

This topic demonstrates how you can:

  • the mapd-connector repository.

  • to a HEAVY.AI server instance.

  • the results of a SQL query.

  • the results on an HTML page.

Clone

Much of the underlying infrastructure you need to interact with a HEAVY.AI server is provided by the mapd-connector repository. You can clone the repository locally to take advantage of its utilities.

To clone the mapd-connector repository:

  1. Go to .

  2. Click Clone or Download.

  3. Choose whether to clone the repository using HTTPS or SSH, or optionally download a Zip archive to expand on your local drive.

For more information on cloning GitHub repositories, see

Open mapd-connector/examples/browser.html in a web browser to connect to a sample HEAVY.AI server instance and display information from the sample database. You can open mapd-connector/examples/browser.js in a text editor and follow along as the following sections describe how the script connects, retrieves, and displays data from the HEAVY.AI server.

Connect

The lynchpin of the application is establishing a connection to HEAVY.AI. Fortunately, the MapdCon object does the heavy lifting for you. You provide the location and port of the HEAVY.AI host and your user credentials to create a connection.

const connector = new window.MapdCon()

connector
  .protocol("https")
  .host("metis.mapd.com")
  .port("443")
  .dbName("heavyai")
  .user("admin")
  .password("HyperInteractive")
  .connectAsync()

Retrieve

Connecting to the HEAVY.AI server is not the final goal, of course. Once you have a connection, you can send SQL queries to retrieve data.

First, create constant variables for your SQL queries.

// The total number of tweets from Columbia
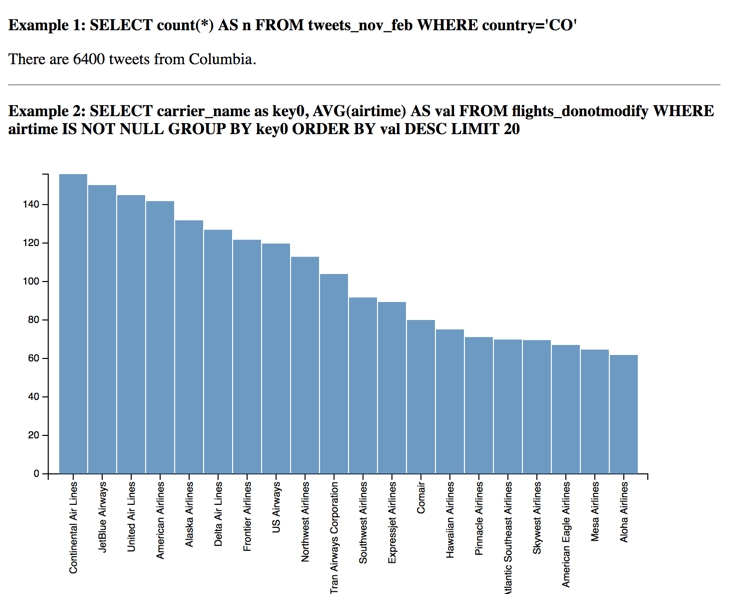
const query = "SELECT count(*) AS n FROM tweets_nov_feb WHERE country='CO'"
// try changing airtime to arrdelay in the query
const query2 =
  "SELECT carrier_name as key0, AVG(airtime) AS val FROM flights_donotmodify WHERE airtime IS NOT NULL GROUP BY key0 ORDER BY val DESC LIMIT 100"

Create an empty array for your query options.

const defaultQueryOptions = {}

Connect as shown above.

const connector = new window.MapdCon()

connector
  .protocol("https")
  .host("metis.mapd.com")
  .port("443")
  .dbName("heavyai")
  .user("admin")
  .password("HyperInteractive")
  .connectAsync()

Use a promise to send a series of queries, including the ones defined as constants.

  .then(session =>
    // now that we have a session open we can make some db calls:
    Promise.all([
      session.getTablesAsync(),
      session.getFieldsAsync("flights_donotmodify"),
      session.queryAsync(query, defaultQueryOptions),
      session.queryAsync(query2, defaultQueryOptions)
    ])
  )

Display

Promise returns a values object with an array of query results. The first item in the values array is a list of tables. Write the results to the browser console.

  .then(values => {
    console.log(
      "All tables available at metis.mapd.com:",
      values[0].map(x => x.name)
    )

The second item in the array contains a list of fields in the table flights_donotmodify.

    // handle result of getFieldsAsync
    console.log(
      "All fields for 'flights_donotmodify':",
      values[1].reduce((o, x) => Object.assign(o, { [x.name]: x }), {})
    )

The third query contains a count of Twitter™ tweets from Columbia. Display that in the HTML page using the DOM.

    // handle result of first query
    document.getElementById("result-async").innerHTML =
      "There are " + values[2][0].n + " tweets from Columbia."
    console.log("Query 1 results:", Number(values[2][0].n))

The final query returns the average air time for flights listed in the flights_donotmodify table, with a limit of 100 records. Display the results as a chart using the createRowChart method.

    // handle result of 2nd query
    createRowChart(values[3])
    console.log(
      "Query 2 results:",
      values[3].reduce((o, x) => Object.assign(o, { [x.key0]: x.val }), {})
    )
  })
  .catch(error => {
    console.error("Something bad happened: ", error)
  })
function createRowChart(data) {
  var margin = { top: 20, right: 20, bottom: 150, left: 40 },
    width = 600
  height = 300

  var x = d3.scale.ordinal().rangeRoundBands([0, width], 0.05)

  var y = d3.scale.linear().range([height, 0])

  var xAxis = d3.svg
    .axis()
    .scale(x)
    .orient("bottom")
    .tickFormat(function(d, i) {
      return d
    })

  var yAxis = d3.svg
    .axis()
    .scale(y)
    .orient("left")
    .ticks(10)

  var svg = d3
    .select("#chart")
    .append("svg")
    .attr("width", width + margin.left + margin.right)
    .attr("height", height + margin.top + margin.bottom)
    .append("g")
    .attr("transform", "translate(" + margin.left + "," + margin.top + ")")

  x.domain(
    data.map(function(d) {
      return d.key0
    })
  )
  y.domain([
    0,
    d3.max(data, function(d) {
      return d.val
    })
  ])

  svg
    .append("g")
    .attr("class", "x axis")
    .attr("transform", "translate(0," + height + ")")
    .call(xAxis)
    .selectAll("text")
    .style("text-anchor", "end")
    .attr("dx", "-.8em")
    .attr("dy", "-.55em")
    .attr("transform", "rotate(-90)")

  svg
    .append("g")
    .attr("class", "y axis")
    .call(yAxis)
    .append("text")
    .attr("transform", "rotate(-90)")
    .attr("y", 6)
    .attr("dy", ".71em")
    .style("text-anchor", "end")

  svg
    .selectAll("bar")
    .data(data)
    .enter()
    .append("rect")
    .style("fill", "steelblue")
    .attr("x", function(d) {
      return x(d.key0)
    })
    .attr("width", x.rangeBand())
    .attr("y", function(d) {
      return y(d.val)
    })
    .attr("height", function(d) {
      return height - y(d.val)
    })
}

Use the array to create a chart using the D3 API. This example is based on an example from the free ebook

D3 Tips and Tricks
https://github.com/heavyai/mapd-connector
https://help.github.com/articles/cloning-a-repository/
Clone
Connect
Retrieve
Display