HEAVY.AI Docs
v8.1.0
v8.1.0
  • Welcome to HEAVY.AI Documentation
  • Overview
    • Overview
    • Release Notes
  • Installation and Configuration
    • System Requirements
      • Hardware Reference
      • Software Requirements
      • Licensing
    • Installation
      • Free Version
      • Installing on Docker
        • HEAVY.AI Installation using Docker on Ubuntu
      • Installing on Ubuntu
        • HEAVY.AI Installation on Ubuntu
        • Install NVIDIA Drivers and Vulkan on Ubuntu
      • Installing on Rocky Linux / RHEL
        • HEAVY.AI Installation on RHEL
        • Install NVIDIA Drivers and Vulkan on Rocky Linux and RHEL
      • Getting Started on AWS
      • Getting Started on GCP
      • Getting Started on Azure
      • Getting Started on Kubernetes (BETA)
      • Upgrading
        • Upgrading HEAVY.AI
        • Upgrading from Omnisci to HEAVY.AI 6.0
        • CUDA Compatibility Drivers
      • Uninstalling
      • Ports
    • Services and Utilities
      • Using Services
      • Using Utilities
    • Executor Resource Manager
    • Configuration Parameters
      • Overview
      • Configuration Parameters for HeavyDB
      • Configuration Parameters for HEAVY.AI Web Server
      • Configuration Parameters for HeavyIQ
    • Security
      • Roles and Privileges
        • Column-Level Security
      • Connecting Using SAML
      • Implementing a Secure Binary Interface
      • Encrypted Credentials in Custom Applications
      • LDAP Integration
    • Distributed Configuration
  • Loading and Exporting Data
    • Supported Data Sources
      • Kafka
      • Using HeavyImmerse Data Manager
      • Importing Geospatial Data
    • Command Line
      • Loading Data with SQL
      • Exporting Data
  • SQL
    • Data Definition (DDL)
      • Datatypes
      • Users and Databases
      • Tables
      • System Tables
      • Views
      • Policies
      • Comment
    • Data Manipulation (DML)
      • SQL Capabilities
        • ALTER SESSION SET
        • ALTER SYSTEM CLEAR
        • DELETE
        • EXPLAIN
        • INSERT
        • KILL QUERY
        • LIKELY/UNLIKELY
        • SELECT
        • SHOW
        • UPDATE
        • Arrays
        • Logical Operators and Conditional and Subquery Expressions
        • Table Expression and Join Support
        • Type Casts
      • Geospatial Capabilities
        • Uber H3 Hexagonal Modeling
      • Functions and Operators
      • System Table Functions
        • generate_random_strings
        • generate_series
        • tf_compute_dwell_times
        • tf_feature_self_similarity
        • tf_feature_similarity
        • tf_geo_rasterize
        • tf_geo_rasterize_slope
        • tf_graph_shortest_path
        • tf_graph_shortest_paths_distances
        • tf_load_point_cloud
        • tf_mandelbrot*
        • tf_point_cloud_metadata
        • tf_raster_contour_lines; tf_raster_contour_polygons
        • tf_raster_graph_shortest_slope_weighted_path
        • tf_rf_prop_max_signal (Directional Antennas)
        • ts_rf_prop_max_signal (Isotropic Antennas)
        • tf_rf_prop
      • Window Functions
      • Reserved Words
      • SQL Extensions
      • HeavyIQ LLM_TRANSFORM
  • HeavyImmerse
    • Introduction to HeavyImmerse
    • Admin Portal
    • Control Panel
    • Working with Dashboards
      • Dashboard List
      • Creating a Dashboard
      • Configuring a Dashboard
      • Duplicating and Sharing Dashboards
    • Measures and Dimensions
    • Using Parameters
    • Using Filters
    • Using Cross-link
    • Chart Animation
    • Multilayer Charts
    • SQL Editor
    • Customization
    • Joins (Beta)
    • Chart Types
      • Overview
      • Bubble
      • Choropleth
      • Combo
      • Contour
      • Cross-Section
      • Gauge
      • Geo Heatmap
      • Heatmap
      • Linemap
      • Number
      • Pie
      • Pointmap
      • Scatter Plot
      • Skew-T
      • Table
      • Text Widget
      • Wind Barb
    • Deprecated Charts
      • Bar
      • Combo - Original
      • Histogram
      • Line
      • Stacked Bar
    • HeavyIQ SQL Notebook
  • HEAVYIQ Conversational Analytics
    • HeavyIQ Overview
      • HeavyIQ Guidance
  • HeavyRF
    • Introduction to HeavyRF
    • Getting Started
    • HeavyRF Table Functions
  • HeavyConnect
    • HeavyConnect Release Overview
    • Getting Started
    • Best Practices
    • Examples
    • Command Reference
    • Parquet Data Wrapper Reference
    • ODBC Data Wrapper Reference
    • Raster Data Wrapper Reference
  • HeavyML (BETA)
    • HeavyML Overview
    • Clustering Algorithms
    • Regression Algorithms
      • Linear Regression
      • Random Forest Regression
      • Decision Tree Regression
      • Gradient Boosting Tree Regression
    • Principal Components Analysis
  • Python / Data Science
    • Data Science Foundation
    • JupyterLab Installation and Configuration
    • Using HEAVY.AI with JupyterLab
    • Python User-Defined Functions (UDFs) with the Remote Backend Compiler (RBC)
      • Installation
      • Registering and Using a Function
      • User-Defined Table Functions
      • RBC UDF/UDTF Example Notebooks
      • General UDF/UDTF Tutorial Notebooks
      • RBC API Reference
    • Ibis
    • Interactive Data Exploration with Altair
    • Additional Examples
      • Forecasting with HEAVY.AI and Prophet
  • APIs and Interfaces
    • Overview
    • heavysql
    • Thrift
    • JDBC
    • ODBC
    • Vega
      • Vega Tutorials
        • Vega at a Glance
        • Getting Started with Vega
        • Getting More from Your Data
        • Creating More Advanced Charts
        • Using Polys Marks Type
        • Vega Accumulator
        • Using Transform Aggregation
        • Improving Rendering with SQL Extensions
      • Vega Reference Overview
        • data Property
        • projections Property
        • scales Property
        • marks Property
      • Migration
        • Migrating Vega Code to Dynamic Poly Rendering
      • Try Vega
    • RJDBC
    • SQuirreL SQL
    • heavyai-connector
  • Tutorials and Demos
    • Loading Data
    • Using Heavy Immerse
    • Hello World
    • Creating a Kafka Streaming Application
    • Getting Started with Open Source
    • Try Vega
  • Troubleshooting and Special Topics
    • FAQs
    • Troubleshooting
    • Vulkan Renderer
    • Optimizing
    • Known Issues and Limitations
    • Logs and Monitoring
    • Archived Release Notes
      • Release 6.x
      • Release 5.x
      • Release 4.x
      • Release 3.x
Powered by GitBook
On this page
  • # Of Groups
  • Null Dimensions
  • Color Palette
  • Custom Measure Formatting
  • Bubble Chart Examples
Export as PDF
  1. HeavyImmerse
  2. Chart Types

Bubble

PreviousOverviewNextChoropleth

Last updated 8 months ago

To learn more about bubble charts and how to create one, please view this .

A Bubble chart is a variation of the Scatter Plot. Aggregated data is grouped by dimension into circles displayed on an x/y axis. Additional measures change the size or color of the circles. A Bubble chart can represent up to four measures for your chosen dimensions (x, y, size, and color).

Features

Quantity

Notes

1+

Minimum 1, no limit, null dimensions optional.

2-4

Measure 1 = x axis, Measure 2 = y axis, Measure 3 = bubble size, Measure 4 = bubble color.

Use a Bubble chart to show a correlation between the x measure and the y measure. When you do not expect a correlation, you can use a Bubble chart to understand the distribution and influence of multiple factors.

# Of Groups

Display up to 100 groups of records. You can enter a value or use the slider to visually set the number of groups.

Null Dimensions

Choose whether to show or hide Null values for your chosen dimension.

Color Palette

You can use a custom palette to visually group values in your chart. By default, data points are colored arbitrarily with a spectrum of solid colors. You can choose to arbitrarily color bubbles with 2, 3, or 4 colors. You can also apply colors to individual Dimension values.

If you set the Color measure, you can choose a gradient to visually express relative quantitative values.

Custom Measure Formatting

You can use custom measure formats for the values in your chart. See .

Bubble Chart Examples

State_name is a handy dimension for this data. Use the average Unemployment_rate as the X Axis, and the average Unemployment total for the Y Axis. Increase the # of Groups to 50 to create an individual bubble for each state.

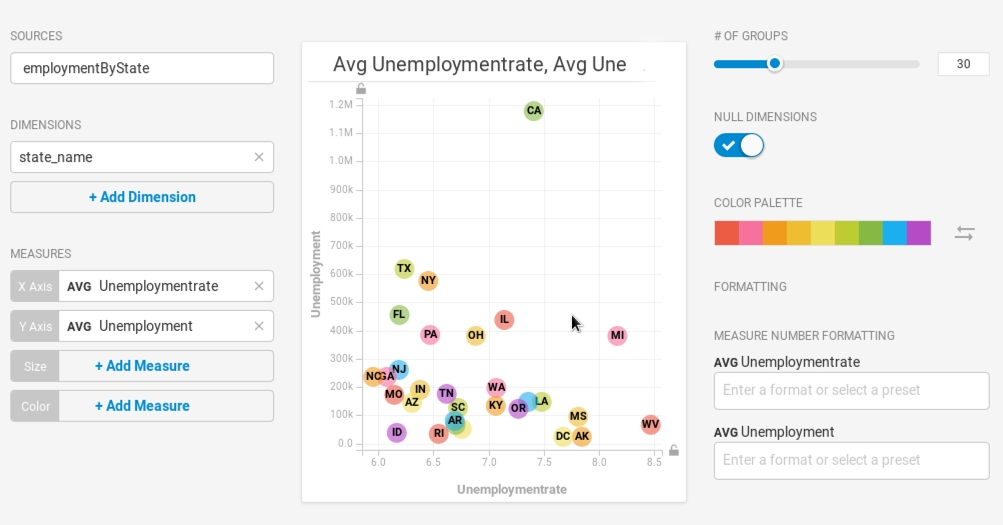
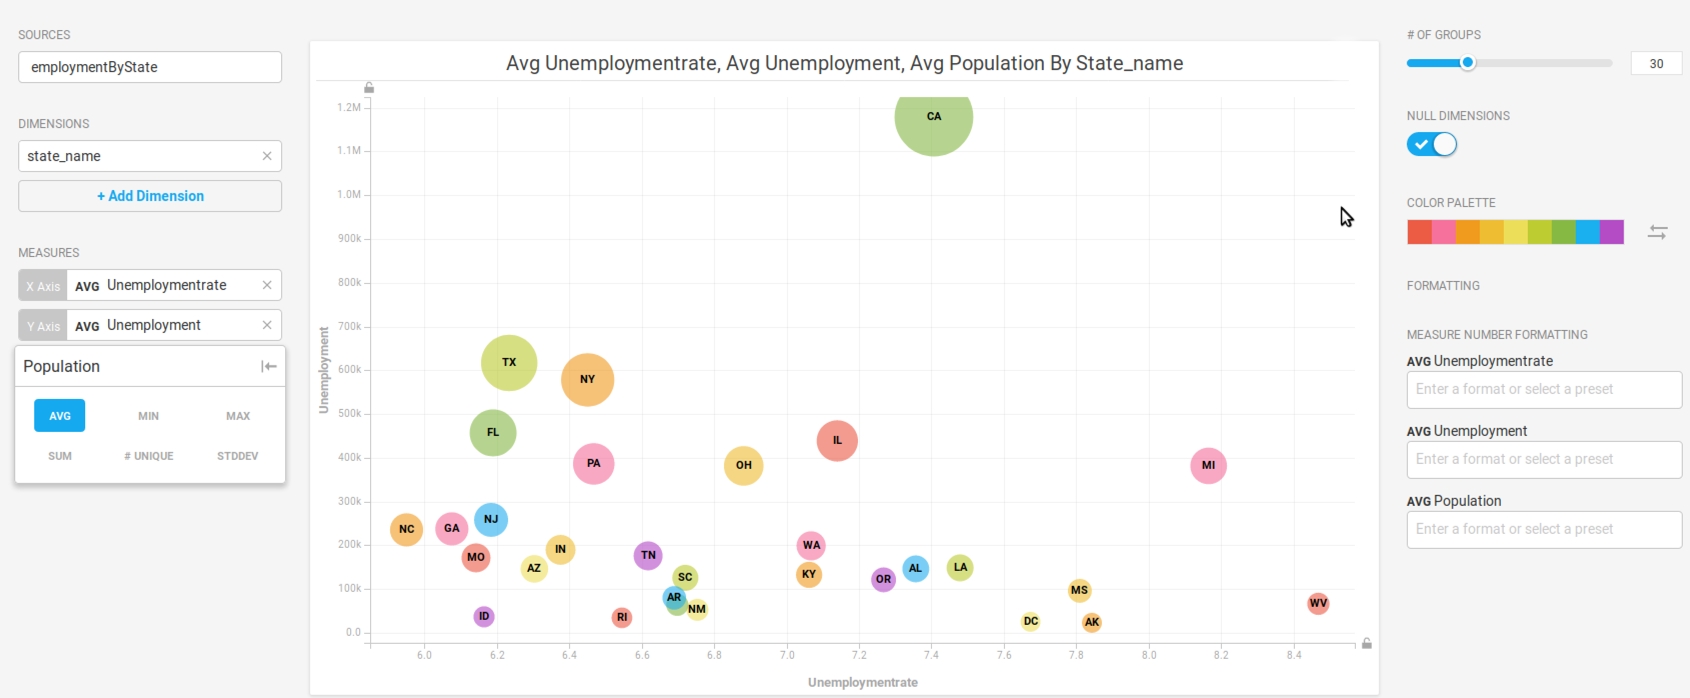
California has a significantly higher number of unemployed residents compared with the other states. Bubble charts are a good way to show outliers in a dataset. But that figure might be misleading. One reason for a higher average number of unemployed persons might be the fact that California is the most populous state in the country. Use Population as the Size measure to create proportionally sized bubbles, based on total population.

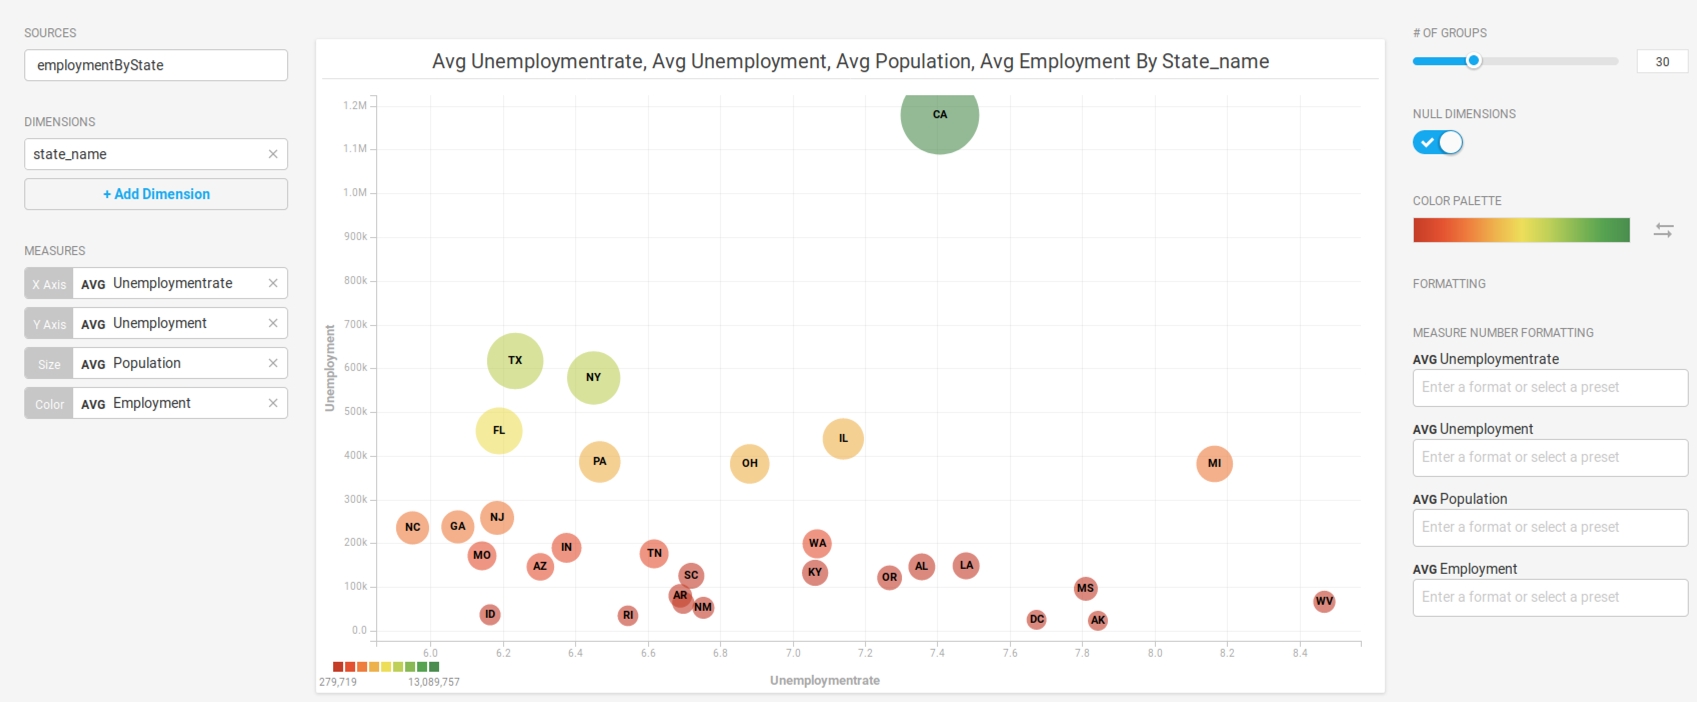
You can add Employment as the Color measure, which casts California in a more favorable light.

Required

Required

Create a new Bubble chart. Choose a Data Source. This example graphs employment statistics for all 50 United States for the years 1980-2015. The data is available at the .

University of Kentucky website
video
Customizing Measure and Date Formats
Dimensions
Measures